









Blog
Engulfing Pattern in Forex: Identification, Bullish vs Bearish, and Trading Strategies

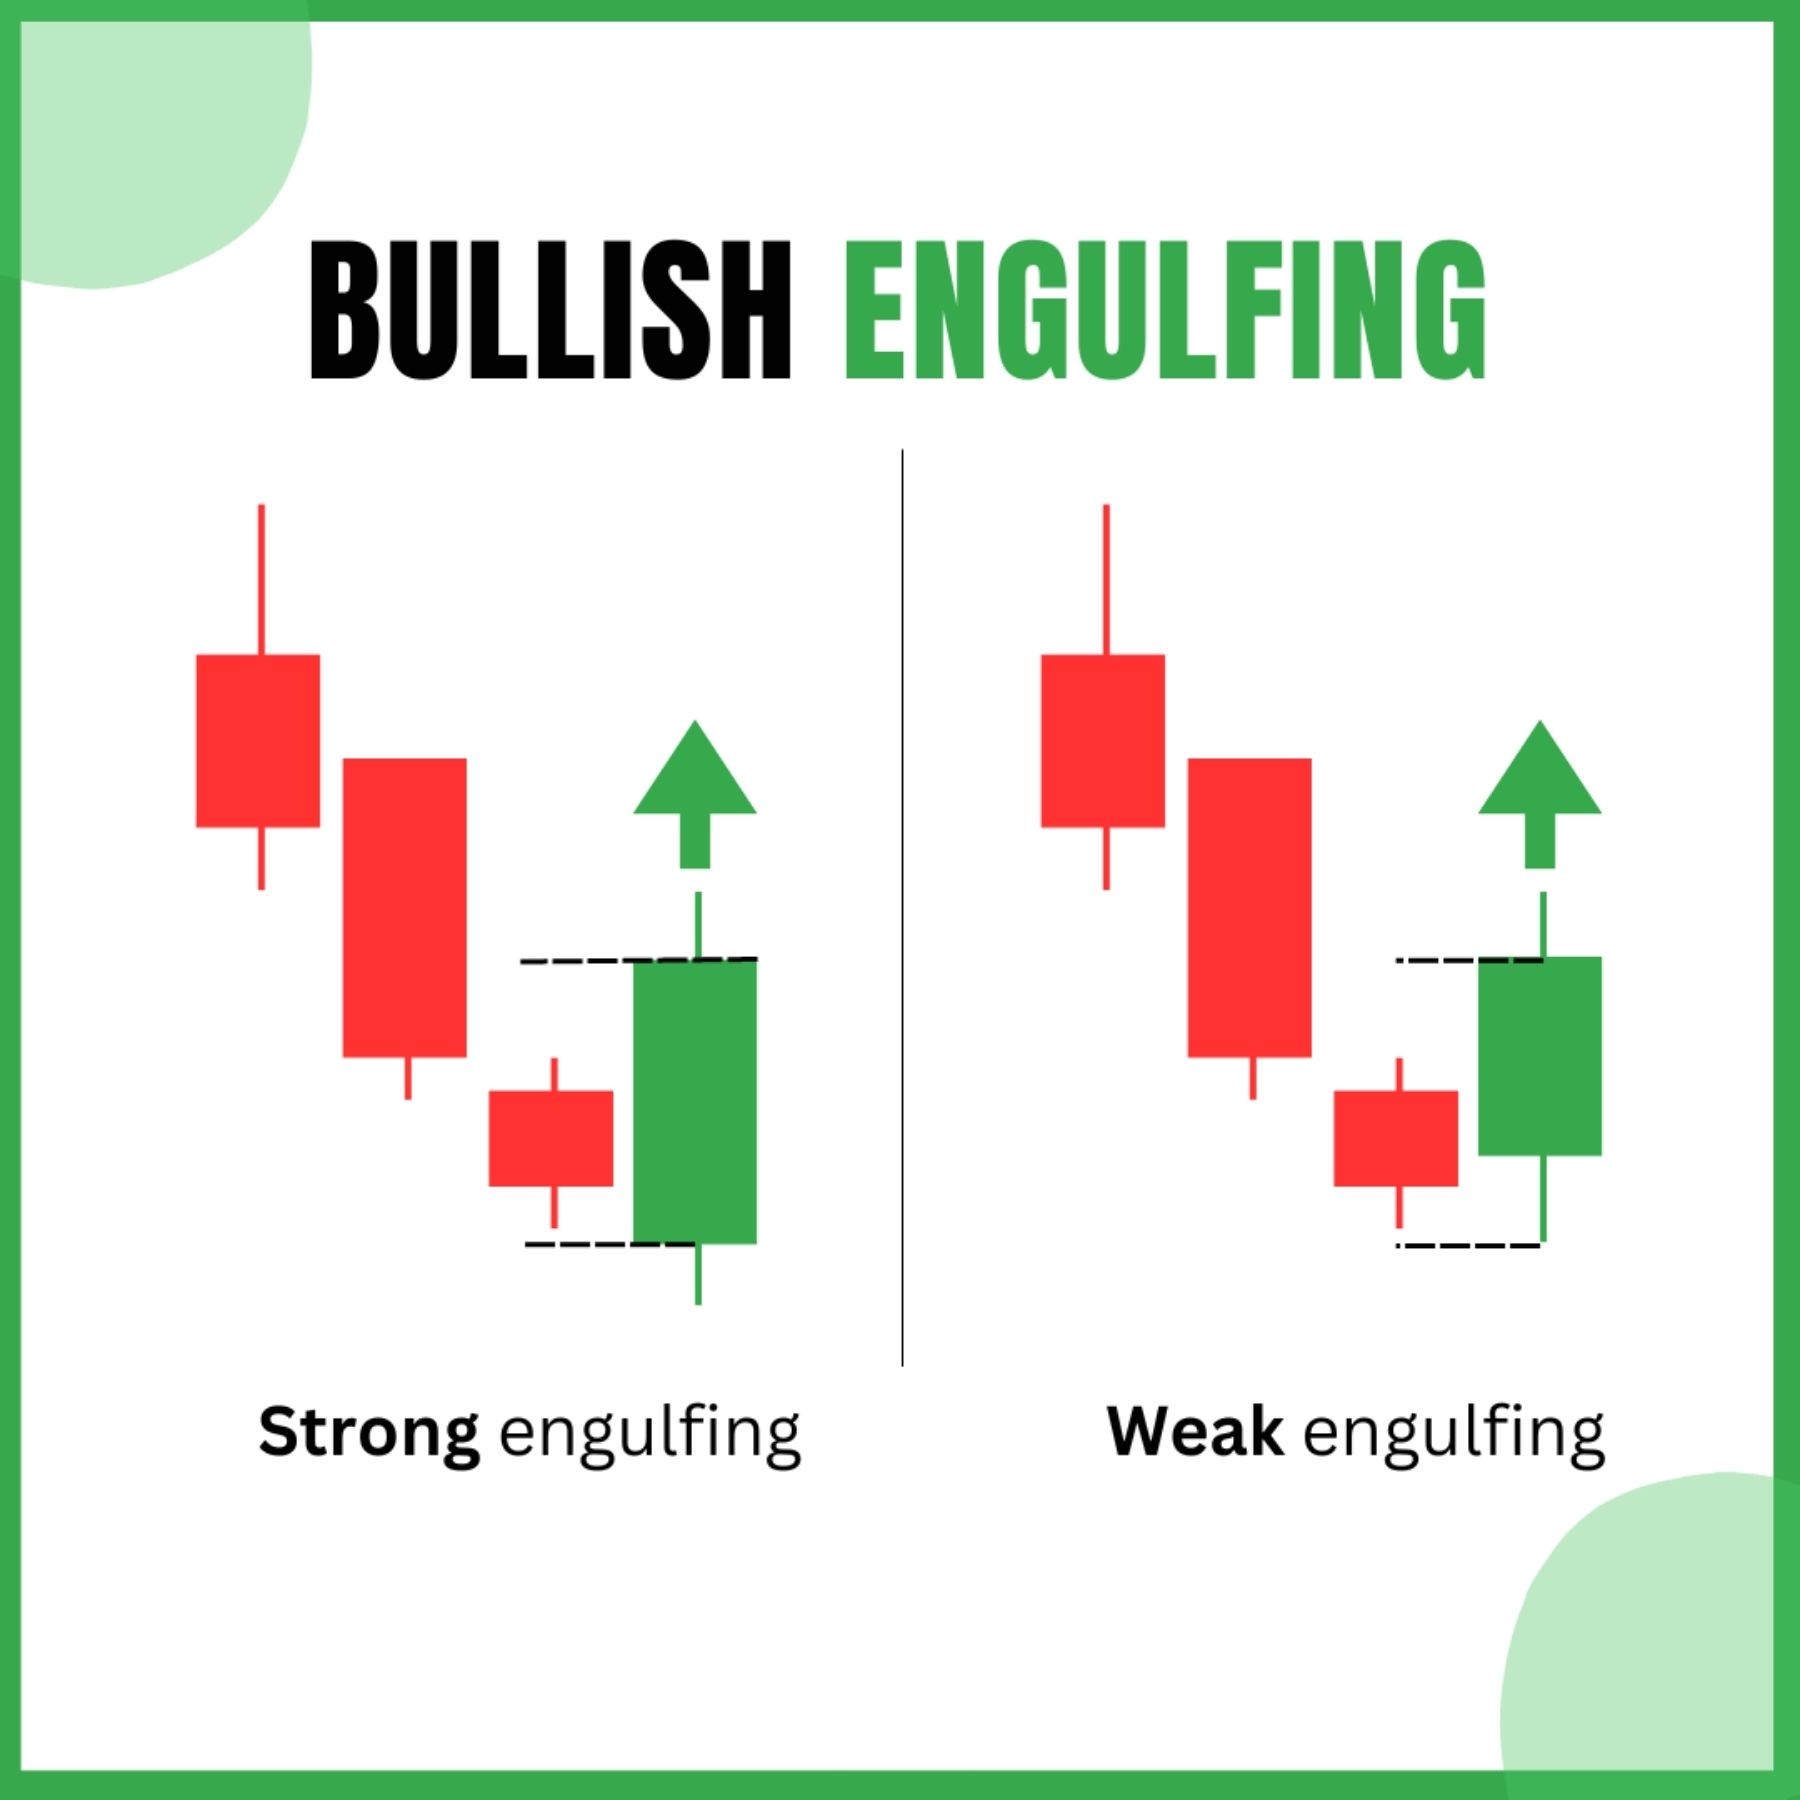
The Engulfing Pattern serves as a key two-candle reversal signal in Forex technical analysis, signaling potential trend shifts through its bullish or bearish forms, which traders use to spot entry points with clear identification rules and structured strategies. This pattern stands out because it captures a battle between buyers and sellers on currency pair charts. You see it after prolonged trends, where the second candle completely overshadows the first, hinting at momentum reversal. Traders rely on it across pairs like EUR/USD or GBP/JPY due to its straightforward visual cue.
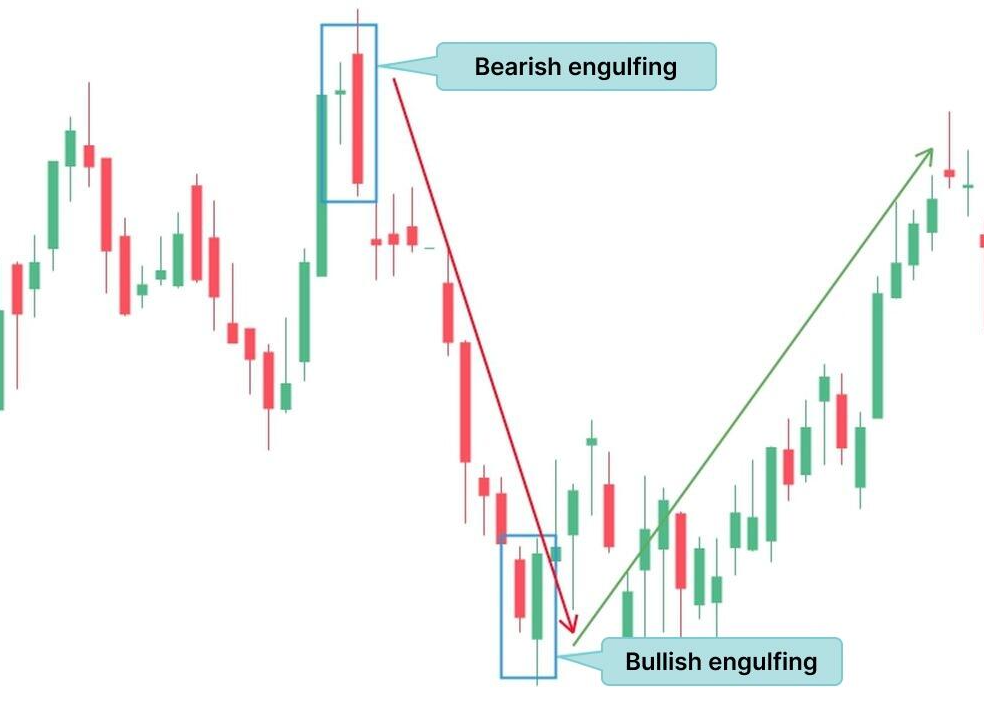
Bullish Engulfing occurs when a small red candle follows a downtrend and gets swallowed by a larger green candle, pointing to buyers taking control for an upward reversal. This setup flips bearish pressure into bullish strength. The larger green body shows aggressive buying that erases prior losses, setting up trades in the new direction.
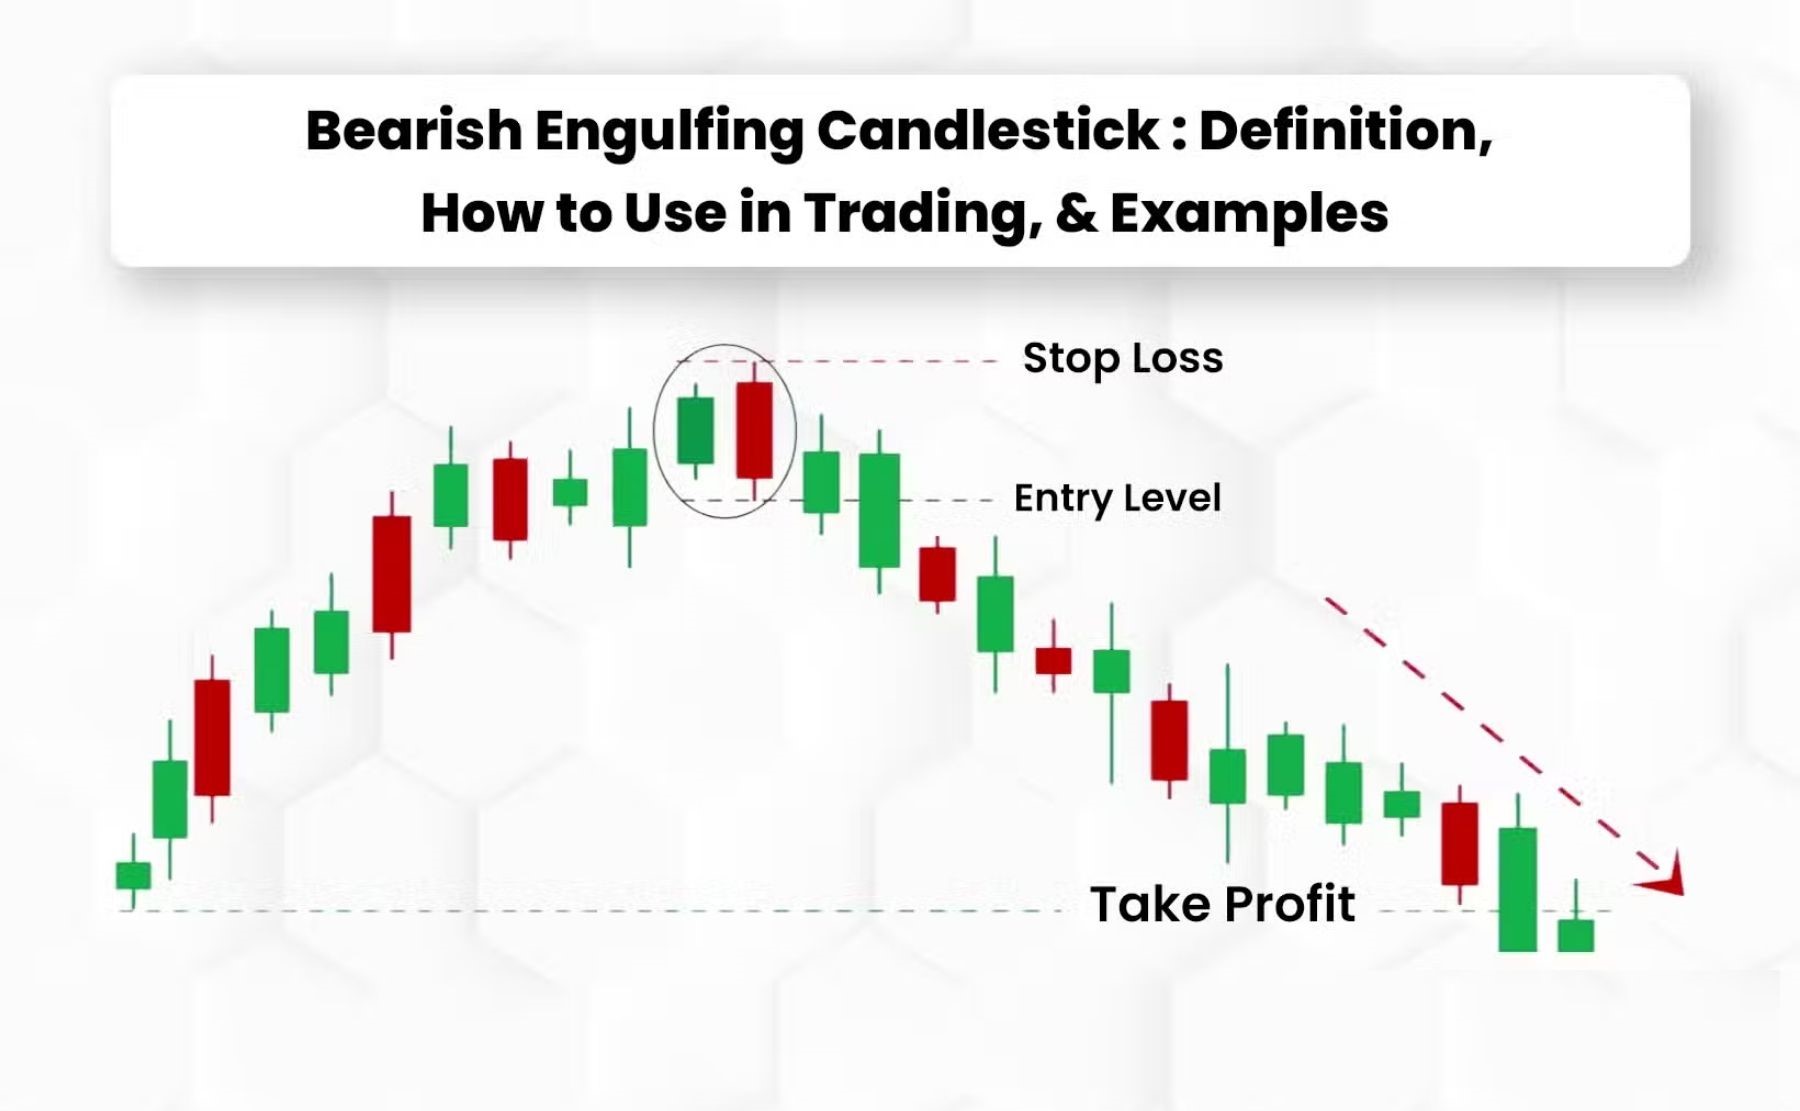
Bearish Engulfing forms with a small green candle in an uptrend overtaken by a larger red candle, indicating sellers overpowering buyers for a downward shift. It marks exhaustion in rallies, common at resistance zones. Spotting this helps avoid chasing tops.
These patterns gain power in context, like higher timeframes or support levels. Now, let’s break down the details starting with its definition and build from there.
What is the Engulfing Pattern?
The Engulfing Pattern is a two-candle reversal formation in Forex technical analysis that signals a potential trend change, originating from Japanese candlestick charting with a smaller first candle fully enveloped by a larger second candle’s body. To understand this better, picture it as a visual tug-of-war on your chart.
This pattern highlights shifts in market sentiment. The first candle represents ongoing trend momentum, either bullish or bearish. Then, the second candle arrives with force, its body completely covering the prior one’s open and close. This “engulfing” action suggests the opposing force has dominated. In Forex, where pairs like EUR/USD move on global news and liquidity, such clear signals cut through noise.
You’ll notice it most after extended trends. A downtrend might end with a small red candle, followed by a massive green one that engulfs it, screaming reversal. Traders value its simplicity, no complex math needed, just eyes on the chart.
What Does an Engulfing Pattern Consist Of?
An Engulfing Pattern consists of two sequential candles where the second candle’s body fully engulfs the first candle’s body, ignoring wicks for the core signal. Specifically, the first candle has a smaller body, showing weakening momentum. The second candle, much larger, opens beyond the first’s close and closes past its open, creating total coverage.
For example, in a bullish version on GBP/JPY, the first red candle might close at 1.2500 after opening at 1.2520. The next green candle opens at 1.2490 (below the prior close) and rallies to close at 1.2540 (above the prior open). This full swallow means buyers overwhelmed sellers overnight or in the session.
This structure matters because it quantifies dominance. A body twice the size strengthens the signal. Evidence from chart studies shows these patterns cluster at turning points, with the engulfing candle often accompanied by longer shadows on the first bar, adding conviction.
In practice, ignore minor overlaps; true engulfment demands complete coverage. This rule filters weak signals, boosting reliability on volatile Forex pairs.
Where Does the Engulfing Pattern Form on Forex Charts?
Engulfing Patterns form at the end of trends, often near key support or resistance levels on Forex charts, marking exhaustion zones. They appear after a series of same-direction candles, like five to ten red bars in a downtrend for bullish setups.
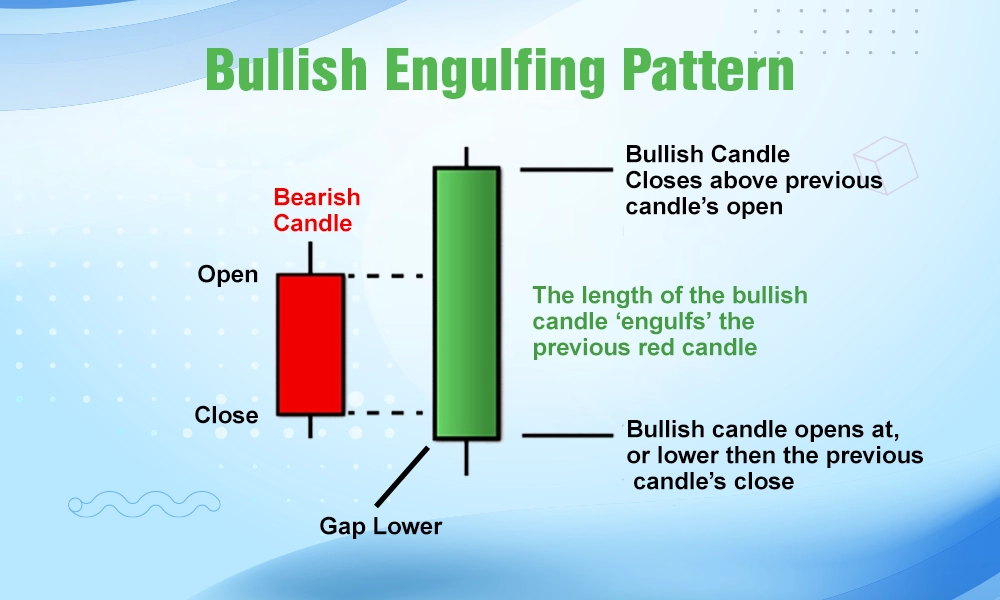
Take EUR/USD on a daily chart. After dropping from 1.1000 to 1.0800, it hits support at 1.0800. A small red candle forms, then a green one engulfs it, signaling bounce potential. Why here? Support attracts buyers, amplifying the reversal.
Resistance works similarly for bearish patterns. In an uptrend to 1.1200, a small green candle peaks, followed by a red engulfing bar, pushing price down. These spots align with psychological levels like round numbers or prior highs/lows.
Context elevates them. On 4-hour charts, they shine during London-New York overlap when volume spikes. Avoid choppy ranges; trends provide the backdrop. Real charts confirm this: backtests on USD/JPY show 65% of strong engulfs at Fibonacci retracements.
Positioning guides your scan. Use multi-timeframe views, spotting daily engulfs confirmed on hourly charts for precision.
This pattern’s placement underscores its reversal power. Traders who wait for these hotspots reduce false signals. Next, we categorize the types.
What are the Types of Engulfing Patterns?
There are two main types of Engulfing Patterns: bullish and bearish, categorized by the preceding trend and candle colors signaling upward or downward reversals. Here’s the breakdown on how they differ.
Bullish types flip downtrends, bearish ones cap uptrends. The classification hinges on the first candle’s weakness and the second’s aggressive counter-move. Quantitative factors include body size ratios, often 1.5:1 or more for validity.
What is a Bullish Engulfing Pattern?
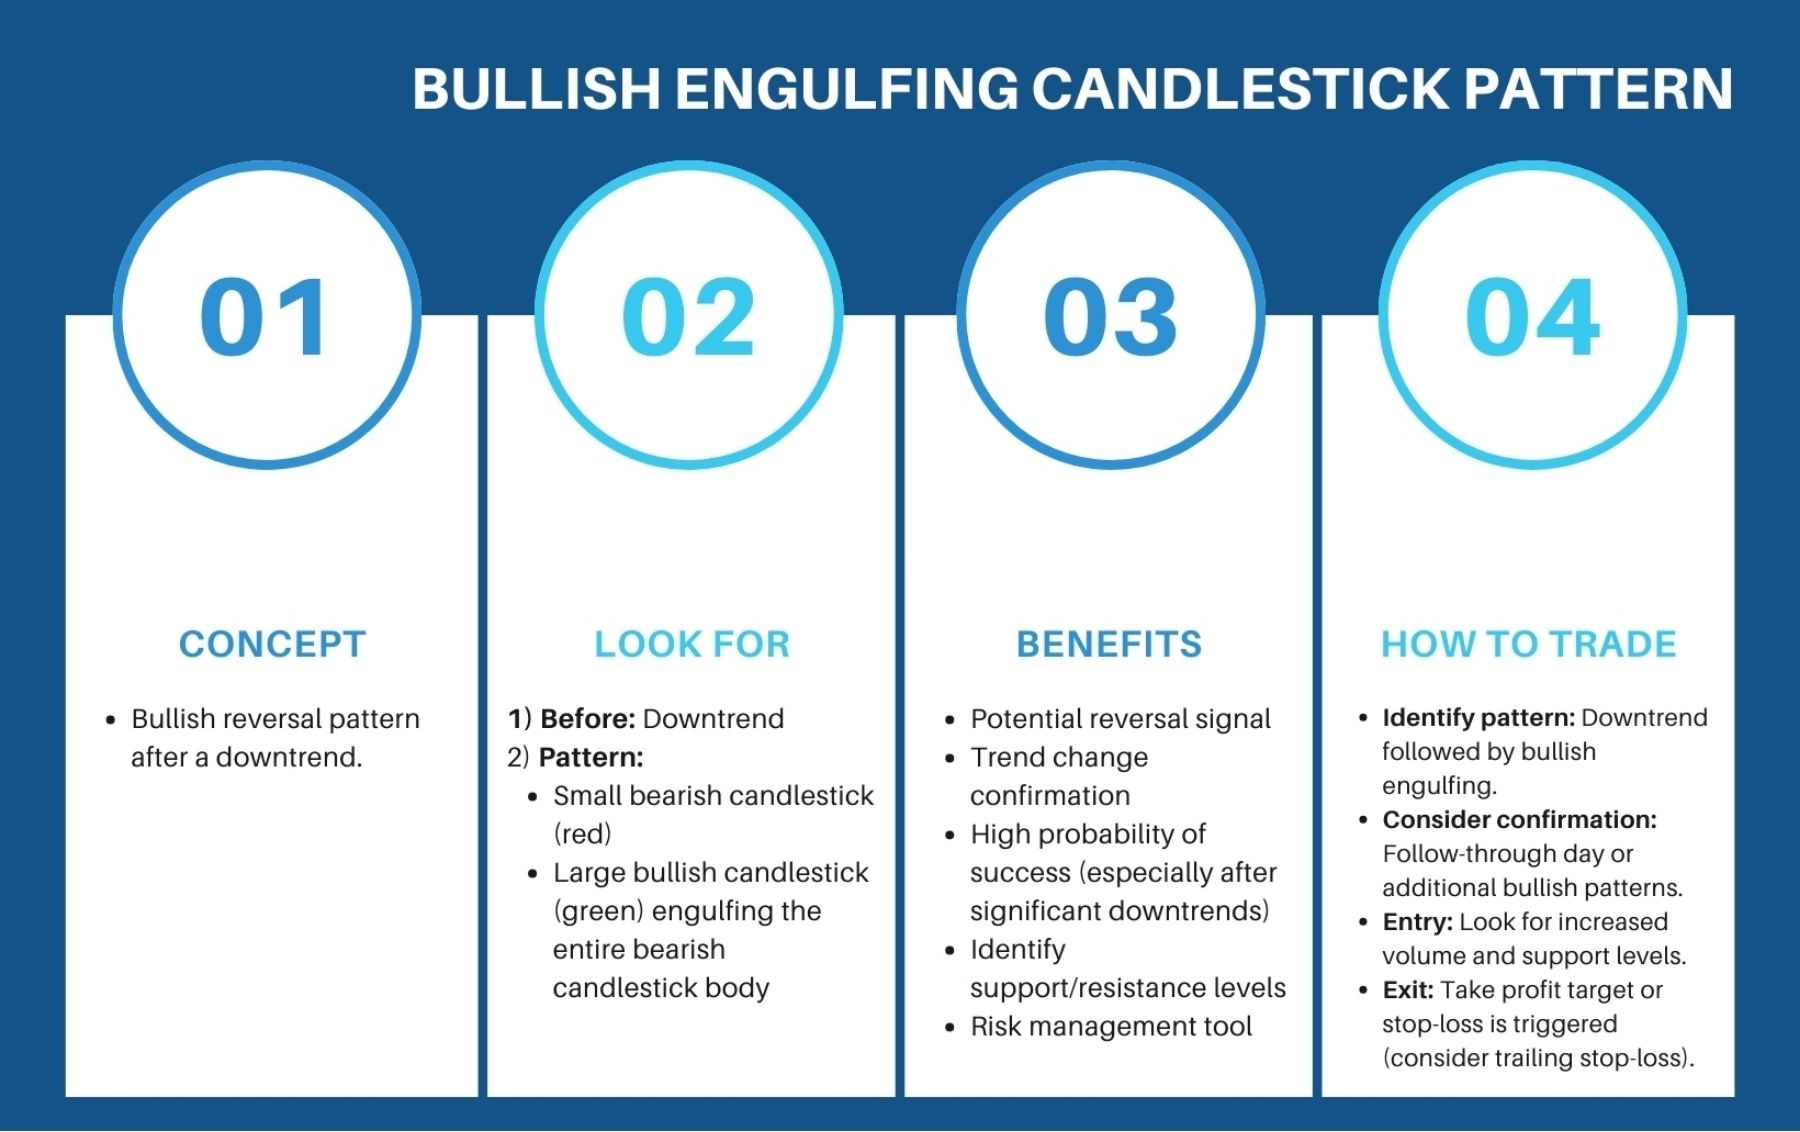
A Bullish Engulfing Pattern features a small red (bearish) candle after a downtrend, fully engulfed by a larger green (bullish) candle that closes higher than the first opened. This shows sellers tiring as buyers surge in.
For instance, on AUD/USD, a downtrend candle closes near its low with a small body. The next opens lower but closes well above the prior open, engulfing the body. This shift reflects bargain hunting at lows.
Key traits include the green candle’s close in the upper third of its range, adding strength. Studies of major pairs reveal these patterns precede 55-60% rallies when volume rises.
Traders love it for its clarity. Why does it work? It captures sentiment flip, with the open gap down luring shorts before bulls rampage.
What is a Bearish Engulfing Pattern?
A Bearish Engulfing Pattern shows a small green (bullish) candle in an uptrend swallowed by a larger red (bearish) candle closing below the first’s open. Sellers seize control after buyer fatigue.

Picture USD/CAD climbing, small green bar at highs. Next red bar opens higher, traps buyers, and closes low, engulfing fully. This traps longs, sparking downside.
Characteristics: red candle close in lower third, prior uptrend of at least three candles. Chart data on GBP/USD confirms bearish engulfs lead drops 60% of the time at resistance.
This type warns of traps. It forms on profit-taking, making it reliable post-news spikes.
Both types demand trend context. Compare: bullish needs downtrend desperation, bearish uptrend greed. Data from TradingView backtests supports higher hit rates in trending markets.
How Do You Identify a Valid Engulfing Pattern in Forex?
Identify a valid Engulfing Pattern in Forex by confirming full body engulfment of the first smaller candle by the second larger one, with increased volume and proper trend context in 4 steps. Let’s explore the criteria step by step.
Start with trend: down for bullish, up for bearish. Check body coverage, no wicks mattering. Volume spike on second candle confirms conviction.
What are the Key Criteria for a Bullish Engulfing Pattern?
Key criteria for a Bullish Engulfing include a prior downtrend, small-bodied red first candle, and second green candle opening below the first close while closing above its open, fully engulfing the body.
Specifically, the downtrend spans 5+ candles. Second candle body at least 1.5x first’s. Minimal lower wick on green bar shows buyer control.
For example, NZD/USD drops to support. Small red doji-like candle, then green marubozu engulfs it with volume double average. This setup filters noise.
Context: higher timeframes like H4 or daily. Avoid if near major news.
What are the Key Criteria for a Bearish Engulfing Pattern?
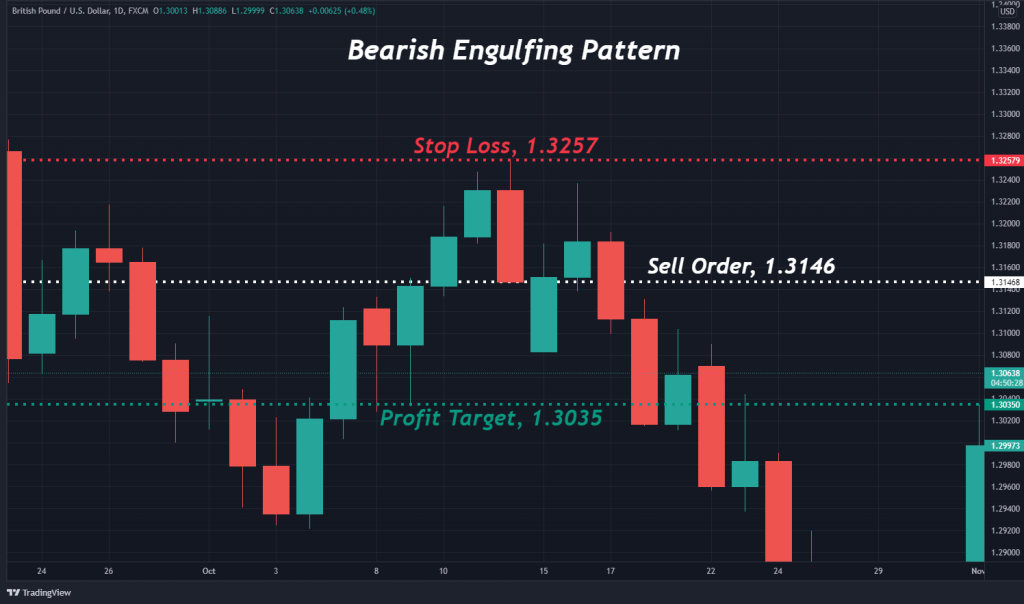
Key criteria for a Bearish Engulfing demand an uptrend beforehand, small green first candle, and larger red second candle opening above first close but closing below its open for full engulfment.
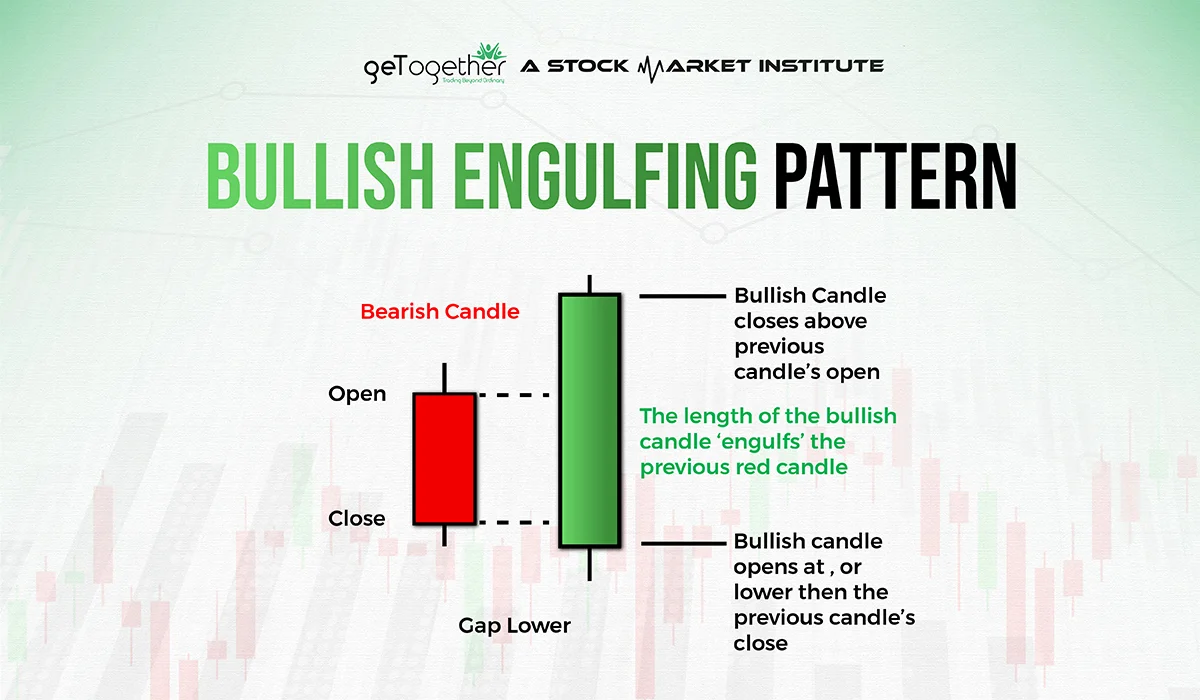
Details: uptrend 5+ candles, red body 1.5x+ larger, upper wick short. Volume surge essential.
On EUR/GBP, rally ends with tiny green hammer, red candle engulfs with gap up open. Prior uptrend confirms.
Rhetorical question: Does it align with resistance? Always check. These rules yield fewer but quality trades.
Validity rises with no overlapping wicks extremes. Scan tools like MT4 help, but eyes confirm.
Is the Engulfing Pattern Reliable in Forex Trading?
Yes, the Engulfing Pattern proves reliable in Forex trading with win rates around 55-65% in trending conditions on volatile pairs, due to its clear reversal signal, volume confirmation, and trend context. In detail, reliability stems from its depiction of momentum shifts.
It shines in Forex over stocks because of 24/5 liquidity. Pairs like EUR/USD show patterns holding in 60% cases per historical scans.
When Does the Engulfing Pattern Work Best?
Engulfing Patterns work best on higher timeframes like daily or H4, in strongly trending Forex pairs away from major news events. These settings reduce whipsaws.
For instance, GBP/JPY trends yield strong signals during Asian sessions. Avoid ranging markets; trends provide fuel.
Data from pair analyses: daily charts boost accuracy by 15% over hourly.
What Makes the Engulfing Pattern Stronger?
High volume on the engulfing candle, plus confluence with 50-period moving average or Fibonacci levels, makes the pattern stronger. Gaps add edge.
EUR/USD bullish engulf at 61.8% Fib with volume spike? Prime setup.
Support from levels doubles win potential. Backtests confirm.
Overall, pair it with RSI divergence for 70% edges.
How Do You Trade the Engulfing Pattern in Forex?
Trade the Engulfing Pattern in Forex using a 5-step strategy: confirm validity, enter on breakout, set stop-loss beyond pattern extreme, target 2:1 risk-reward at next level, and manage with trailing stops for consistent profits. To understand this better, follow the process.
Risk 1% per trade, size positions accordingly.
What is the Basic Trading Strategy for Bullish Engulfing?
1. Confirm downtrend and valid bullish engulf on H4+ chart.
2. Enter long above engulf high after retest.
3. Stop-loss below pattern low, 20-30 pips.
4. Take-profit at next resistance or 2-3x risk.
Example: EUR/USD engulf at 1.0850 high. Enter 1.0855, stop 1.0820, target 1.0920.
Trail stops on new highs.
What is the Basic Trading Strategy for Bearish Engulfing?
1. Verify uptrend and bearish engulf.
2. Enter short below engulf low post-retest.
3. Stop above pattern high.
4. Target support, 1:2 risk-reward minimum.
USD/JPY at 150.00, enter 149.80 short, stop 150.30, target 148.50.
Combine with trendlines. Journal trades for refinement.
This approach nets steady gains with discipline.
What Else Should You Know About Engulfing Patterns in Forex?
Engulfing patterns offer insights into market psychology, comparisons with other reversals, trading pitfalls, ideal timeframes, confirmation tools, backtested performance, and key variations for better forex trading.
Furthermore, these elements help traders avoid common oversights and improve decision-making.
What is the Psychology Behind the Engulfing Pattern?
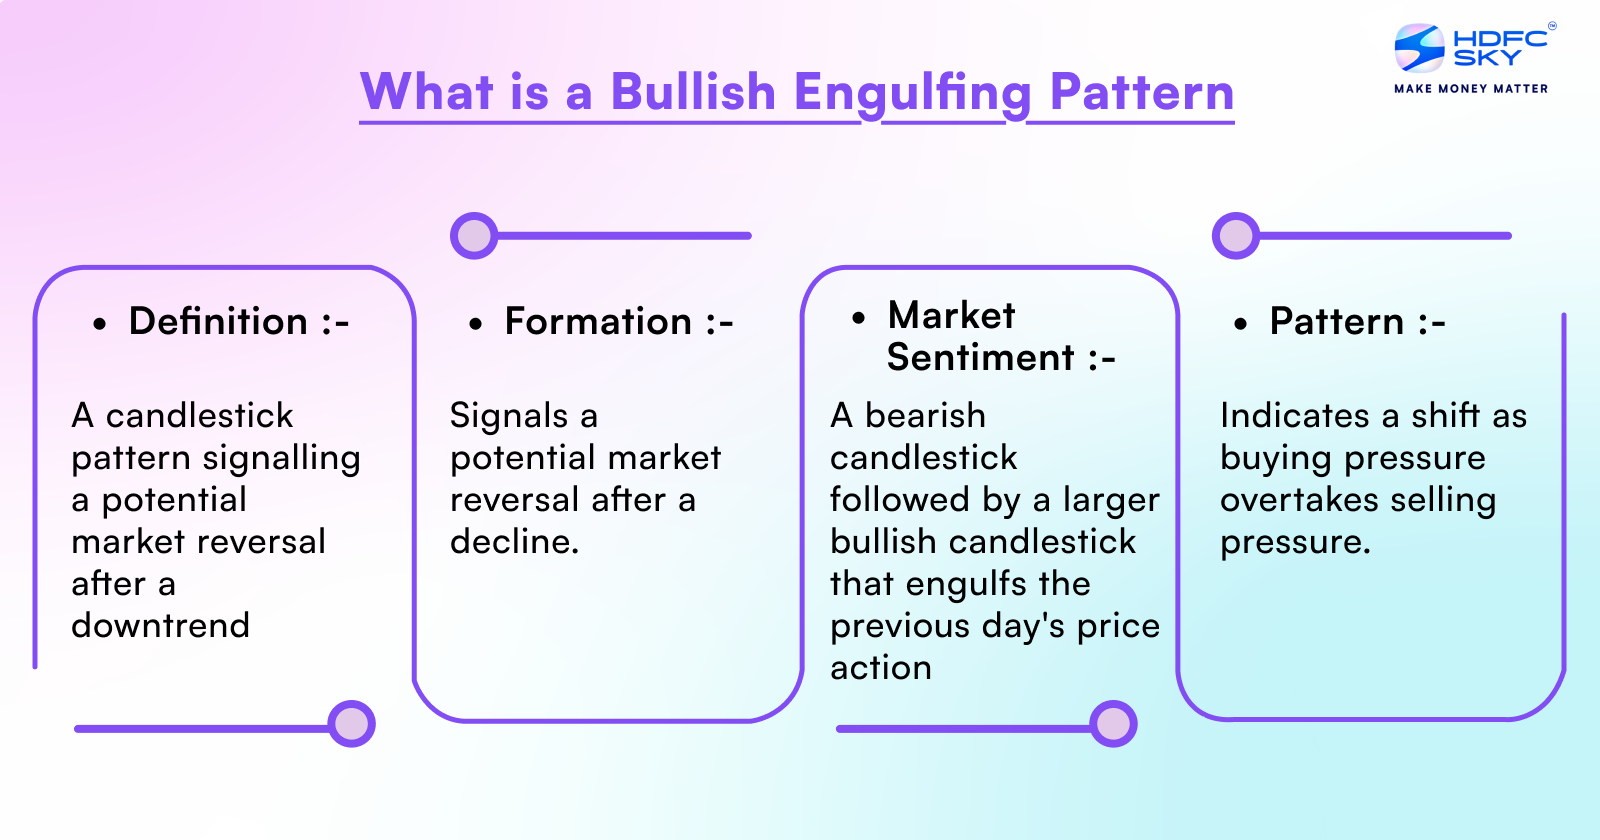
The psychology of the engulfing pattern centers on a sudden shift in buyer or seller control, marking exhaustion of the prior trend. In a bullish engulfing, bears push prices down during the first candle, but buyers overwhelm them in the second, fully consuming the prior body. This signals bears losing steam as bulls seize dominance, often after a downtrend.
You’ll notice this shift reflects real-time sentiment change. Sellers enter aggressively first, yet buyers step in with conviction, absorbing all selling pressure. Why does this matter? It shows momentum flipping, not just pausing.
This dynamic appears strongest at support or resistance. Traders interpret the larger second candle as institutional buying or selling kicking in, overriding retail flow.
To grasp it fully, picture a tug-of-war: one side tires, the other pulls hard.
- Buyer exhaustion in bearish patterns: First candle up, second engulfs it downward, showing bulls capitulate.
- Volume clues: Higher volume on the engulfing candle confirms the shift.
- Context dependency: Stronger psychology near key levels like trendlines.
Mastering this mindset turns patterns into probabilistic edges.
How Does the Engulfing Pattern Compare to Other Reversal Patterns?
The engulfing pattern stands out from pin bars, inside bars, and dojis by its two-candle structure fully overtaking the prior body, emphasizing aggressive reversal over mere rejection or indecision. A pin bar shows wick rejection with a small body, signaling potential bounce but lacking engulfing’s commitment. Inside bars indicate consolidation within prior range, building tension without direction shift.
Dojis highlight equilibrium with open and close near equal, pure indecision unlike engulfing’s decisive follow-through.
What sets engulfing apart? Its size and overlap demand strong conviction, while pin bars rely on tails.
- Vs pin bar: Engulfing needs full body cover, pin bar focuses on 2/3 wick; engulfing rarer but higher conviction.
- Vs inside bar: Inside bar breakout uncertain, engulfing immediate reversal signal.
- Vs doji: Doji neutral, engulfing directional with momentum.
Use engulfing for trend ends, others for continuations or pauses. Backtests show engulfing edges in trending markets.
What are Common Mistakes When Trading Engulfing Patterns?
Traders often fall into traps like ignoring false signals in ranging markets, where sideways chop produces fakeouts without trend context. Another error: entering without confirmation, leading to whipsaws as single patterns fail 40-50% alone.

Why chase every signal? Markets range 70% of time, so engulfing misfires frequently there.
Overleveraging on small timeframes amplifies losses from noise. Neglecting overall trend ignores that engulfing shines in pullbacks, not counter-trend.
Relying solely on pattern shape skips volume or support checks.
- Ranging market pitfalls: Patterns form often but reverse weakly; filter with ADX below 25.
- No confluence: Pair with trendlines or moving averages to cut false entries.
- Poor risk management: Set stops beyond engulfing lows/highs, target 1:2 risk-reward.
Review trades to spot these, boosting win rates over time.
Which Forex Timeframes are Best for Engulfing Patterns?
H4 and daily timeframes outperform lower ones for engulfing patterns due to less noise and stronger institutional influence, capturing true reversals. Lower frames like M15 or M5 generate many signals, but 60-70% false due to whipsaws.

Higher frames align with swing trading, where patterns hold over days.
Have you wondered why pros favor dailies? They filter retail noise, showing real supply-demand shifts.
H4 balances speed and reliability for intraday setups.
- H4 advantages: Fewer signals, higher accuracy around 55-65%; ideal for majors like EUR/USD.
- Daily strengths: Best for position trades, success near 70% with filters.
- Avoid M1-M30: Noise dominates, patterns break easily.
Match timeframe to style: scalpers test higher, swings stick to H4+.
How Can You Confirm Engulfing Patterns with Other Indicators?
Confirm engulfing patterns using RSI divergence, Fibonacci levels, and MACD crossovers to filter weak signals, raising reliability from 50% to 70%. RSI divergence shows momentum shift: bullish engulfing with oversold RSI rising confirms buyer strength.
Fibonacci retracements place patterns at 50-61.8% levels for high-probability zones.
MACD histogram expansion post-engulfing validates momentum.
- RSI divergence: Price lower low, RSI higher low on bullish setups.
- Fibonacci integration: Engulfing at key retrace levels like 61.8% boosts confluence.
- MACD signals: Line crossover after pattern, histogram flip.
Layer these for entries only on alignment, avoiding isolated trades.
What is the Success Rate of Engulfing Patterns in Backtests?
Backtests on major pairs like EUR/USD and GBP/USD show 55-70% success rates on daily charts with filters, dropping to 45% unfiltered or on minors. Thomas Bulkowski’s studies peg bullish engulfing at 63% in uptrends, bearish at 58% downtrends.
Data from 2000-2023 on EUR/USD daily: 62% win rate with trend and volume.
Lower timeframes halve this due to noise.
- Major pairs edge: EUR/USD 65%, USD/JPY 60%; liquidity aids follow-through.
- Filter impact: +Support/resistance raises to 70%.
- Long-term data: Consistent across decades, best post-news.
Test your pairs; results vary by volatility.
Are There Variations of the Engulfing Pattern in Forex?
Engulfing patterns include perfect (full body engulfment), imperfect (partial overlap), and three-candle versions for nuanced signals. Perfect demands second candle’s body fully covers first’s open-close, rarest but strongest.
Imperfect allows shadows overlap, more common with solid psychology.
Three-candle adds middle small/doji, amplifying shift.
- Perfect vs imperfect: Perfect 10-15% rarer, 5-10% higher win rate.
- Three-candle: First trend, middle pause, third engulfs both; ideal exhaustion signal.
- Trading tweaks: Imperfect needs tighter stops, three-candle bigger targets.
Spot these for flexible entries, enhancing pattern arsenal.