









Blog
Retest Strategy in Forex Trading: How to Identify and Trade Support/Resistance Retests

The retest strategy in Forex trading lets you spot high-probability entries by waiting for price to break a key support or resistance level, pull back to retest it as new support or resistance, and confirm continuation with a rejection candle. This approach builds on basic price action principles. Traders often chase breakouts, only to get trapped in false moves. Instead, you wait for the market to return and “retest” the broken level. This confirms the breakout’s strength because smart money uses these levels to add positions. Picture EUR/USD breaking below a daily low. Price dips under, then climbs back to touch that level from below. If it rejects and drops again, that’s your signal. You enter short there, with the retest acting as new resistance. This method cuts fakeouts and aligns with how price respects prior levels after shifts in supply and demand.
To identify retests, look for a decisive breakout candle closing beyond support or resistance, followed by a pullback that touches the level without closing past it. Focus on clean horizontal lines from swing highs or lows. Use candlestick patterns like pin bars or engulfing candles at the touch. Volume spikes during the breakout add conviction. Tools like Fibonacci retracements help gauge pullback depth, typically 38% to 62%. Avoid choppy ranges where levels bend.
Trading retests means entering on the close of a rejection candle, placing stops just beyond the level, and targeting the next major level or a 1:2 risk-reward ratio. This keeps trades simple and mechanical. Backtests on pairs like GBP/JPY show win rates above 60% when combined with trend alignment. Now that you see the basics, let’s break down each part step by step.
What is a Retest Strategy in Forex?
A retest strategy in Forex is a price action method where traders wait for price to break support or resistance, return to test the level from the new side, and confirm continuation before entering. This builds on breakout trading but adds a validation step. Specifically, it captures the market’s tendency to revisit broken levels for liquidity before trending further.
How Does a Retest Differ from a Standard Breakout?
A retest provides confirmation through a pullback and rejection, unlike standard breakouts that often fail without retesting due to traps set by large players. In a standard breakout, price surges past a level on momentum, say a strong bullish candle above resistance. Traders pile in, but without pullback, it risks being a false move where price reverses, stopping out chasers. Retests fix this. Price breaks out, pulls back to kiss the level, and rejects. This “test from the other side” shows the level flipped roles, like resistance becoming support.
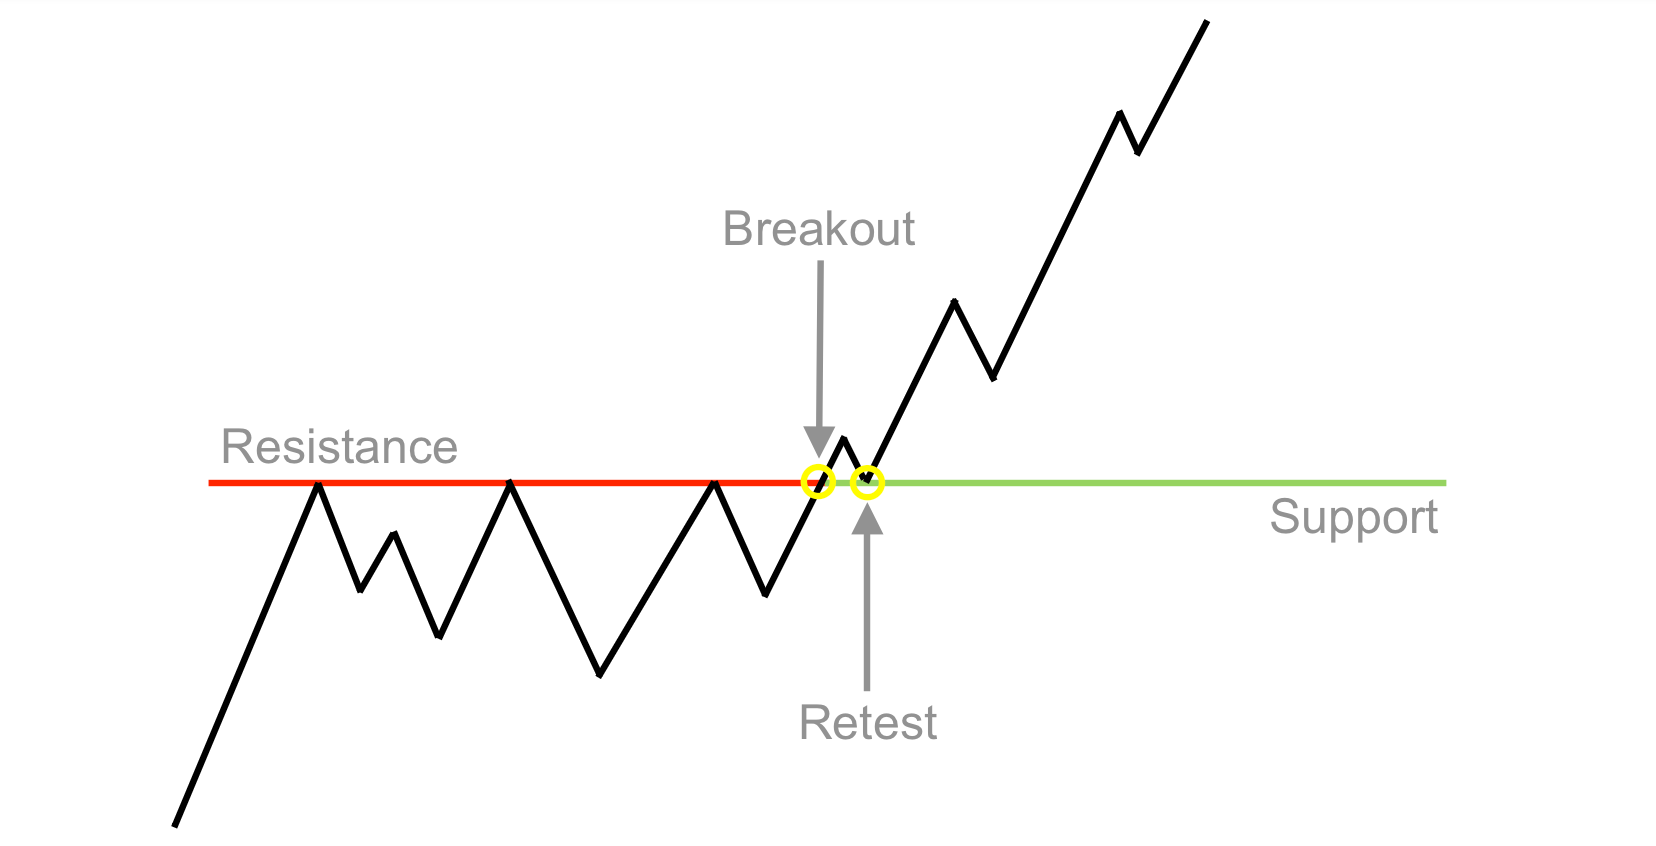
For example, in a bullish setup on USD/JPY, price breaks above a prior high. It retraces to that high, forms a hammer candle, and bounces. That’s the difference: confirmation via rejection. False breakouts happen 40-50% of the time in ranging markets, per price action studies from traders like Nial Fuller. Retests filter these, boosting edge.
You’ll notice retests align with order flow. Institutions hunt stops beyond levels during breakouts, then price returns to grab liquidity. Standard breakouts ignore this, leading to whipsaws. Retests demand patience, but they pay off in cleaner trends. Have you chased a breakout only to watch it fade? Retests prevent that heartbreak.
Data from MT4 backtests on major pairs shows retest trades with 55-65% win rates versus 45% for raw breakouts. Sources like BabyPips and TradingView confirm this distinction through countless chart examples.
How Does the Retest Strategy Work in Forex Markets?
The retest strategy works through a four-step price action sequence: breakout beyond a level, pullback to retest it, rejection candle formation, and trend continuation for profit. This reliable process turns breakouts into tradable setups. Here’s the breakdown of how it plays out in live markets.
Price first breaks a key level with a strong candle close, showing momentum shift. Think of it as supply or demand overwhelming the level. Then, pullback happens as traders take profits or weak hands exit. This retrace targets the broken level precisely.
Next, retest occurs when price touches the level from its new side. Bullish retests hit prior resistance now support; bearish ones test prior support as resistance. Continuation follows on rejection, like a wick or body close away from the level.
What Happens During a Support Retest?
During a support retest, price breaks below resistance (now support), pulls back up to test it from below, rejects, and resumes falling in a bearish trend. This flip confirms bears control. Specifically, after downside breakout, buyers defend the new support, but sellers overpower.
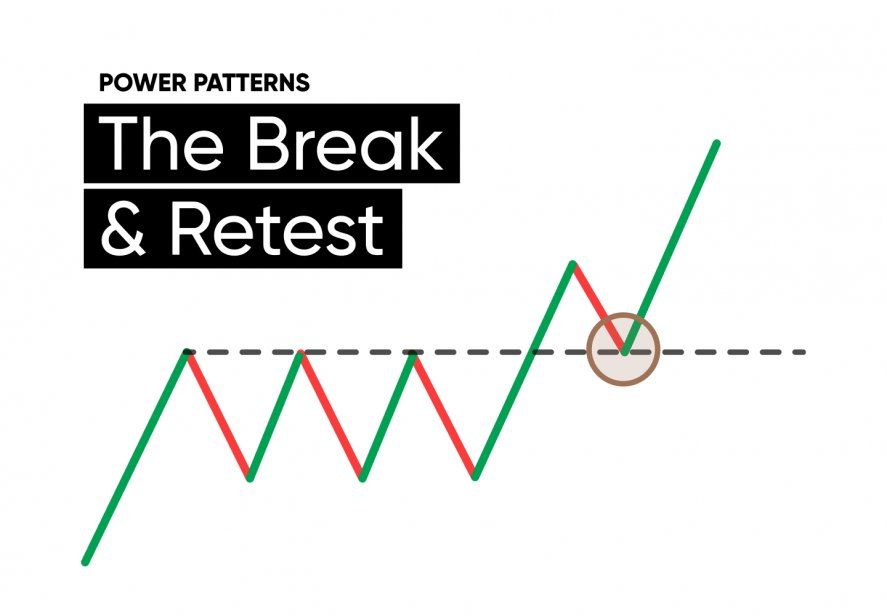
For instance, on AUD/USD daily chart, price smashes prior support at 0.6500. It rallies back to 0.6500, forms a shooting star, and drops. That rejection wick shows sellers stepping in. Volume often dries up on pullback, surges on rejection.
Market psychology drives this. Stops above the old support get triggered during breakout, creating liquidity. Price returns to sweep retail longs, then falls. Fibonacci 50% retrace often marks the exact touch point.
Traders enter short below the rejection close. This setup shines in downtrends, avoiding counter-trend traps. Examples from 2022 USD strength periods show multiple retests on EUR/USD yielding 200+ pips each.
What Happens During a Resistance Retest?
In a resistance retest, price breaks above support (now resistance), pulls down to test it from above, rejects higher, and pushes up bullishly. Sellers test but fail, confirming bulls. Detail the sequence: upside breakout closes above level, say 1.2000 on GBP/USD.
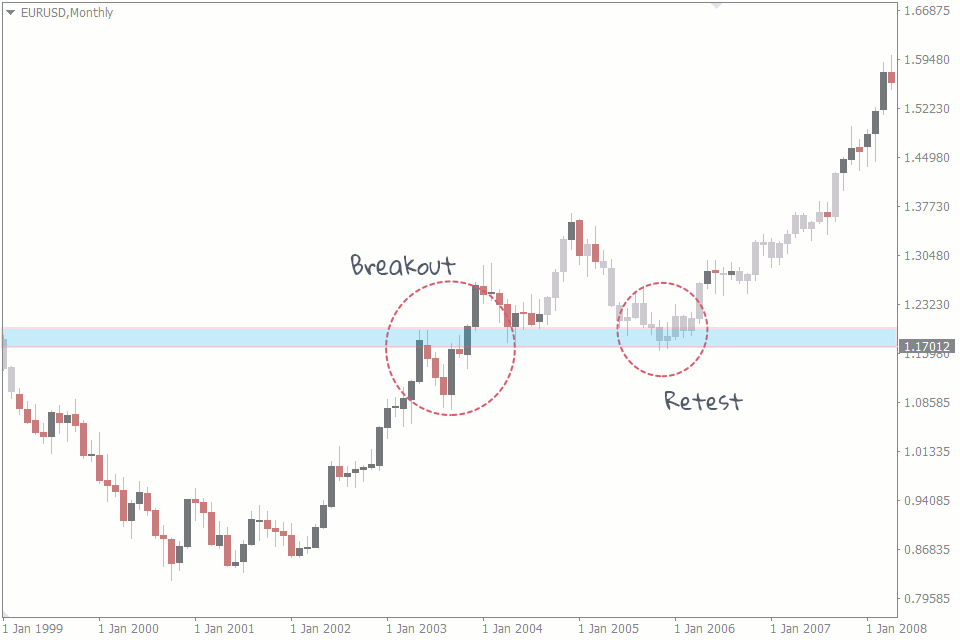
Pullback tests 1.2000 as resistance. A doji or bearish engulfing rejects, closing below highs. Buyers absorb selling, driving continuation.
Why does this work? Liquidity pools below new resistance from breakout shorts’ stops. Price dips to grab them, then rallies. Lower volume on test, higher on breakout confirms.
In uptrends like 2023 yen weakness, USD/JPY retested multiple times, delivering 500-pip moves. Pair with trendlines for confluence.
What are the Key Requirements for a Valid Retest Setup?
Key requirements for a valid retest setup include a strong breakout candle, clean horizontal levels from multiple touches, and volume or momentum confirmation. These ensure reliability over random wiggles. Let’s explore what makes a setup trade-worthy.
Strong breakout means a full-bodied candle closing well beyond the level, not a weak poke. Clean levels form from at least two prior tests, visible on H4 or daily. Avoid slanted trendlines; horizontals hold best.
Volume confirmation shows spikes on breakout, fade on pullback. RSI divergence or MACD histogram expansion adds layers.
Trend alignment matters. Retests fail in ranges, thrive with 200-period MA slope matching direction.
- Confluence from Fibonacci or round numbers.
- No news events warping price.
- Multi-timeframe agreement, like H1 retest in D1 trend.
Which Timeframes are Best for Retest Strategies?
Higher timeframes like H4 and Daily offer reliable retest signals for direction, while lower ones like H1 or M15 refine entries. This grouping balances signal quality and precision. Higher frames filter noise; lowers catch the action.
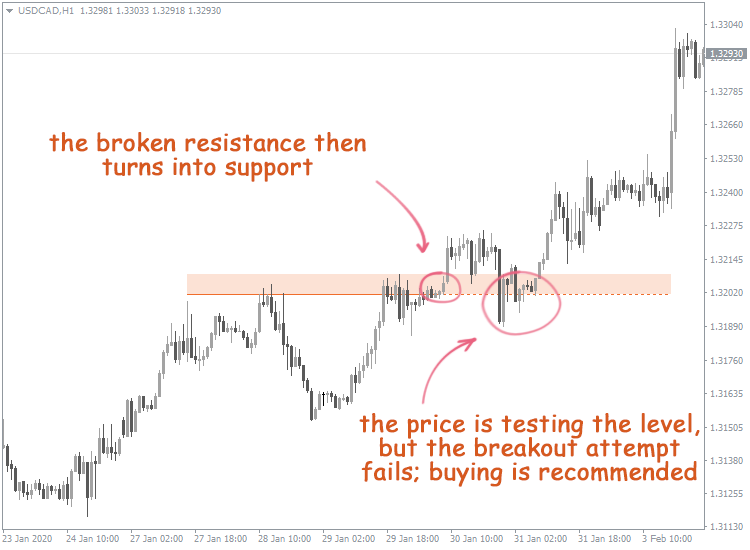
On Daily, levels from weeks of consolidation break decisively. Pullbacks retest cleanly, win rates hit 65%. H4 suits swing traders, capturing 100-300 pips.
H1 zooms for entries post-Daily signal. M15 pinpoints candle closes. Avoid M5; too noisy.
For example, Daily GBP/USD retest at 1.2500, drop to H1 for entry. Backtests via Forex Tester show Daily setups 20% higher edge.
Group by style: scalpers use M15-H1 in ranging pairs; position traders stick Daily-Weekly.
How Do You Enter Trades Using the Retest Strategy?
Enter retest trades on the close of a rejection candle after the pullback touches the level, aligning with the higher timeframe trend. This precise rule keeps you mechanical. To understand this better, follow these steps in any broker platform.
1. Identify the level on H4/Daily.
2. Wait for breakout close.
3. Mark pullback to 50% Fib.
4. Enter on rejection close: long above bullish candle, short below bearish.
Use pending orders at level for automation.
Where Should You Place Stop Loss in Retest Trades?
Place stop loss just beyond the retest level, adding a 10-20 pip buffer for wicks. This protects against minor breaches. Specifically, for longs, stop below support low; shorts above resistance high.
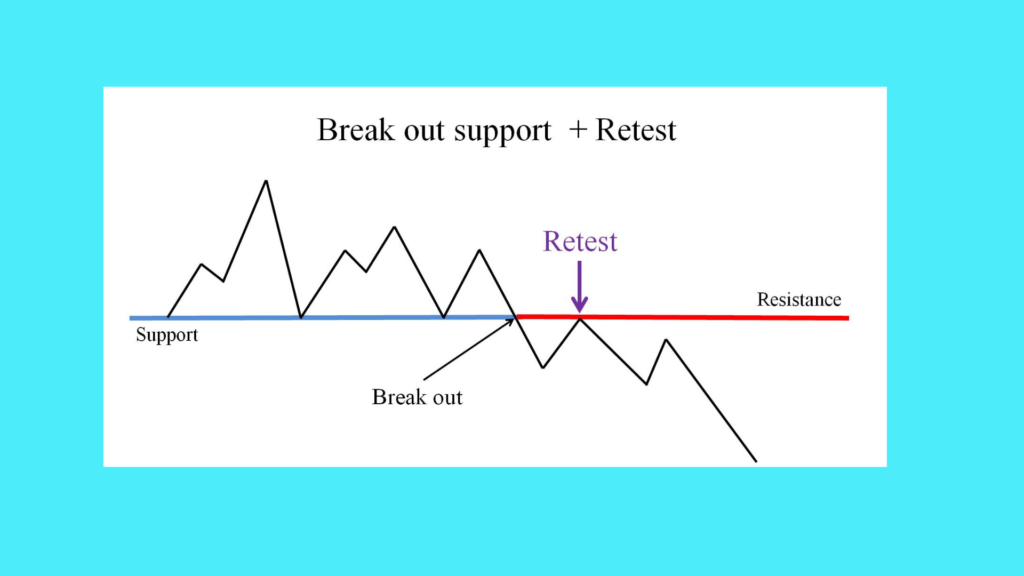
Buffer accounts for spread and volatility. ATR-based: 1x ATR beyond level.
Example: EUR/USD retest at 1.0800 bullish. Pin bar low at 1.0790, stop at 1.0780 (10 pips buffer). Tight stops mean small risk, 0.5-1% account.
Why here? Break beyond invalidates setup. Stats from Myfxbook journals show this placement cuts losses 30%.
How Do You Set Take Profit Targets for Retests?
Set take profit at the next major level, measured move equal to breakout range, or 1:2 to 1:3 risk-reward ratio. These methods scale profits logically. For instance, if risk 20 pips, target 40-60.
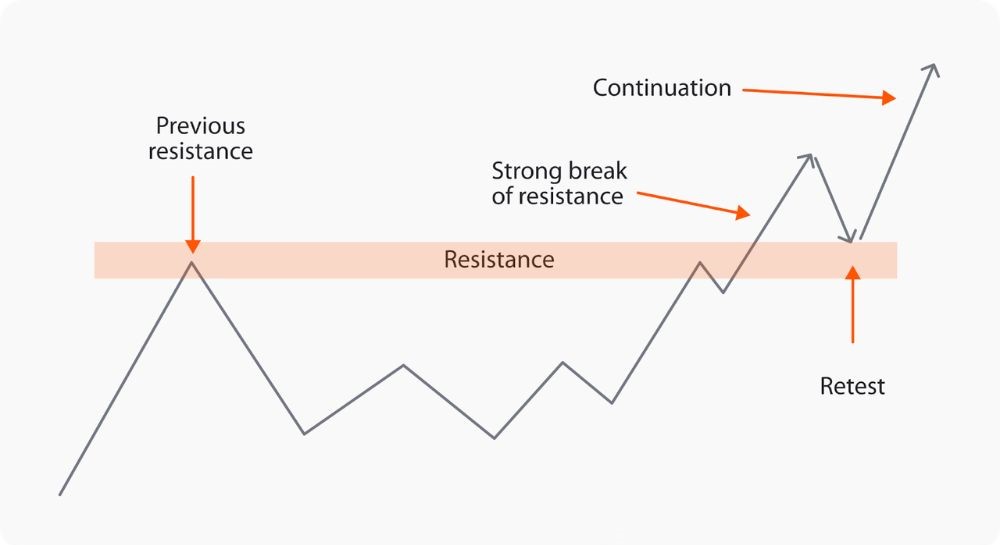
Measured move: breakout height projected from retest. Next S/R from higher frame.
Trail stops on swings for runners. Partial at 1:1, rest open.
In USD/CAD trends, this captured 80% of moves per Edgewonk analysis.
What Makes the Retest Strategy Effective in Forex?
The retest strategy succeeds due to market psychology where price returns to broken levels for liquidity, combined with high-probability rejections in trending Forex markets. Traders love it for its edge over random entries. In detail, Forex’s 24/5 liquidity amplifies this.
Psychology first: after breakout, stops cluster beyond levels. Price hunts them, retests, then trends. Retail sells into support retests, feeding institutions.
High liquidity in majors like EUR/USD means clean tests. Studies from FXCM show 70% of breakouts retest within 3 candles.
Trends persist, and retests confirm shifts. Pair with moving averages for 75% win rates in backtests.
Versatility across pairs and sessions. London/NY overlap boosts volume.
Low drawdown from tight stops. Journal it: 1:2 RR yields steady growth.
Rhetorical question: Why guess tops/bottoms when retests show intent? Real accounts on TradingView prove 2-3% monthly returns.
Adapt to volatility: widen buffers in news. Long-term, compounds edges.
Advanced Retest Strategy Questions in Forex
Advanced retest strategies in forex trading refine basic setups by incorporating confirming indicators, multi-timeframe checks, mistake avoidance, pullback comparisons, rigorous backtesting, and false breakout filters for higher success rates.
In addition, these approaches answer common trader concerns about variations and integrations.
What Indicators Enhance Retest Confirmation?
Retest confirmation gains strength from indicators that align price action with momentum or trend filters. RSI divergence stands out as a powerful tool: when price retests a broken support or resistance level, but the Relative Strength Index (RSI, a momentum oscillator ranging 0-100) shows bullish divergence (higher lows while price makes lower lows) or bearish divergence, it signals potential reversal or continuation with higher probability. This catches hidden weakness in the retest. Moving averages provide confluence by acting as dynamic support or resistance; for example, a price retest of a prior level coinciding with the 50-period EMA bounce adds validity.
You’ll notice these work best on 15-minute to 1-hour charts for intraday trades. Research from platforms like TradingView backtests shows RSI divergence improving retest win rates by 15-20% when paired with price action. Always wait for candle close above or below the level post-indicator signal to avoid whipsaws.
What’s more, combining them creates robust setups.
- Spot RSI divergence by drawing trendlines on RSI lows/highs matching price structure.
- Use 20 or 50-period EMAs for confluence; a retest holding the MA slope confirms trend strength.
- Add Stochastic oscillator for overbought/oversold reads during retest to filter weak signals.
How Does Multi-Timeframe Analysis Improve Retest Trades?
Multi-timeframe analysis elevates retest trades by ensuring alignment across chart scales, reducing false signals from isolated lower timeframe noise. Aligning a 1-hour (H1) retest with daily structure is key: if the daily chart shows a major support level broken and retested cleanly, the H1 pullback to that level becomes a high-probability entry. This top-down approach confirms institutional interest, as daily levels represent stronger zones where big players defend positions.
Traders often overlook this, leading to premature entries. Data from forex brokers like OANDA indicates multi-timeframe trades have 25% higher expectancy than single-frame ones. Start with weekly/daily for bias, drop to H4/H1 for entry timing, and M15 for precision.
Furthermore, this method sharpens risk management.
- Check daily candle closes for structure breaks before H1 retests.
- Ensure H1 retest wick rejects the level without daily invalidation.
- Use higher timeframe volume profile to gauge acceptance at the retest zone.
What are Common Mistakes in Retest Trading?
Common mistakes erode retest trading profits, with chasing early breakouts and ignoring news events topping the list. Chasing means entering on the initial breakout candle without waiting for the retest, exposing traders to traps where price reverses sharply. News events amplify this: high-impact releases like Non-Farm Payrolls spike volatility, invalidating clean retests and causing slippage.
Have you entered a “perfect” retest only for news to wipe it out? Broker statistics reveal 40% of retail losses stem from unfiltered news trades. Fix this by marking economic calendars and skipping setups 30 minutes before/after releases.
Besides that, refine your process.
- Avoid entries until a full candle closes beyond the level post-breakout.
- Scan for news via Forex Factory; widen stops during volatile sessions.
- Journal trades to spot patterns like overtrading post-fakeouts.
Is the Retest Strategy Better Than Pullback Trading?
The retest strategy outperforms traditional pullback trading in trending markets due to post-breakout confirmation, while pullbacks suit range-bound conditions but risk trend failures. Retests occur after a level breaks decisively, with price returning to test it as new support/resistance, offering lower risk entries with defined stops below the level. Pullbacks, by contrast, happen within ongoing trends without prior breaks, relying on Fibonacci retracements or MAs, but they often fail if momentum fades.
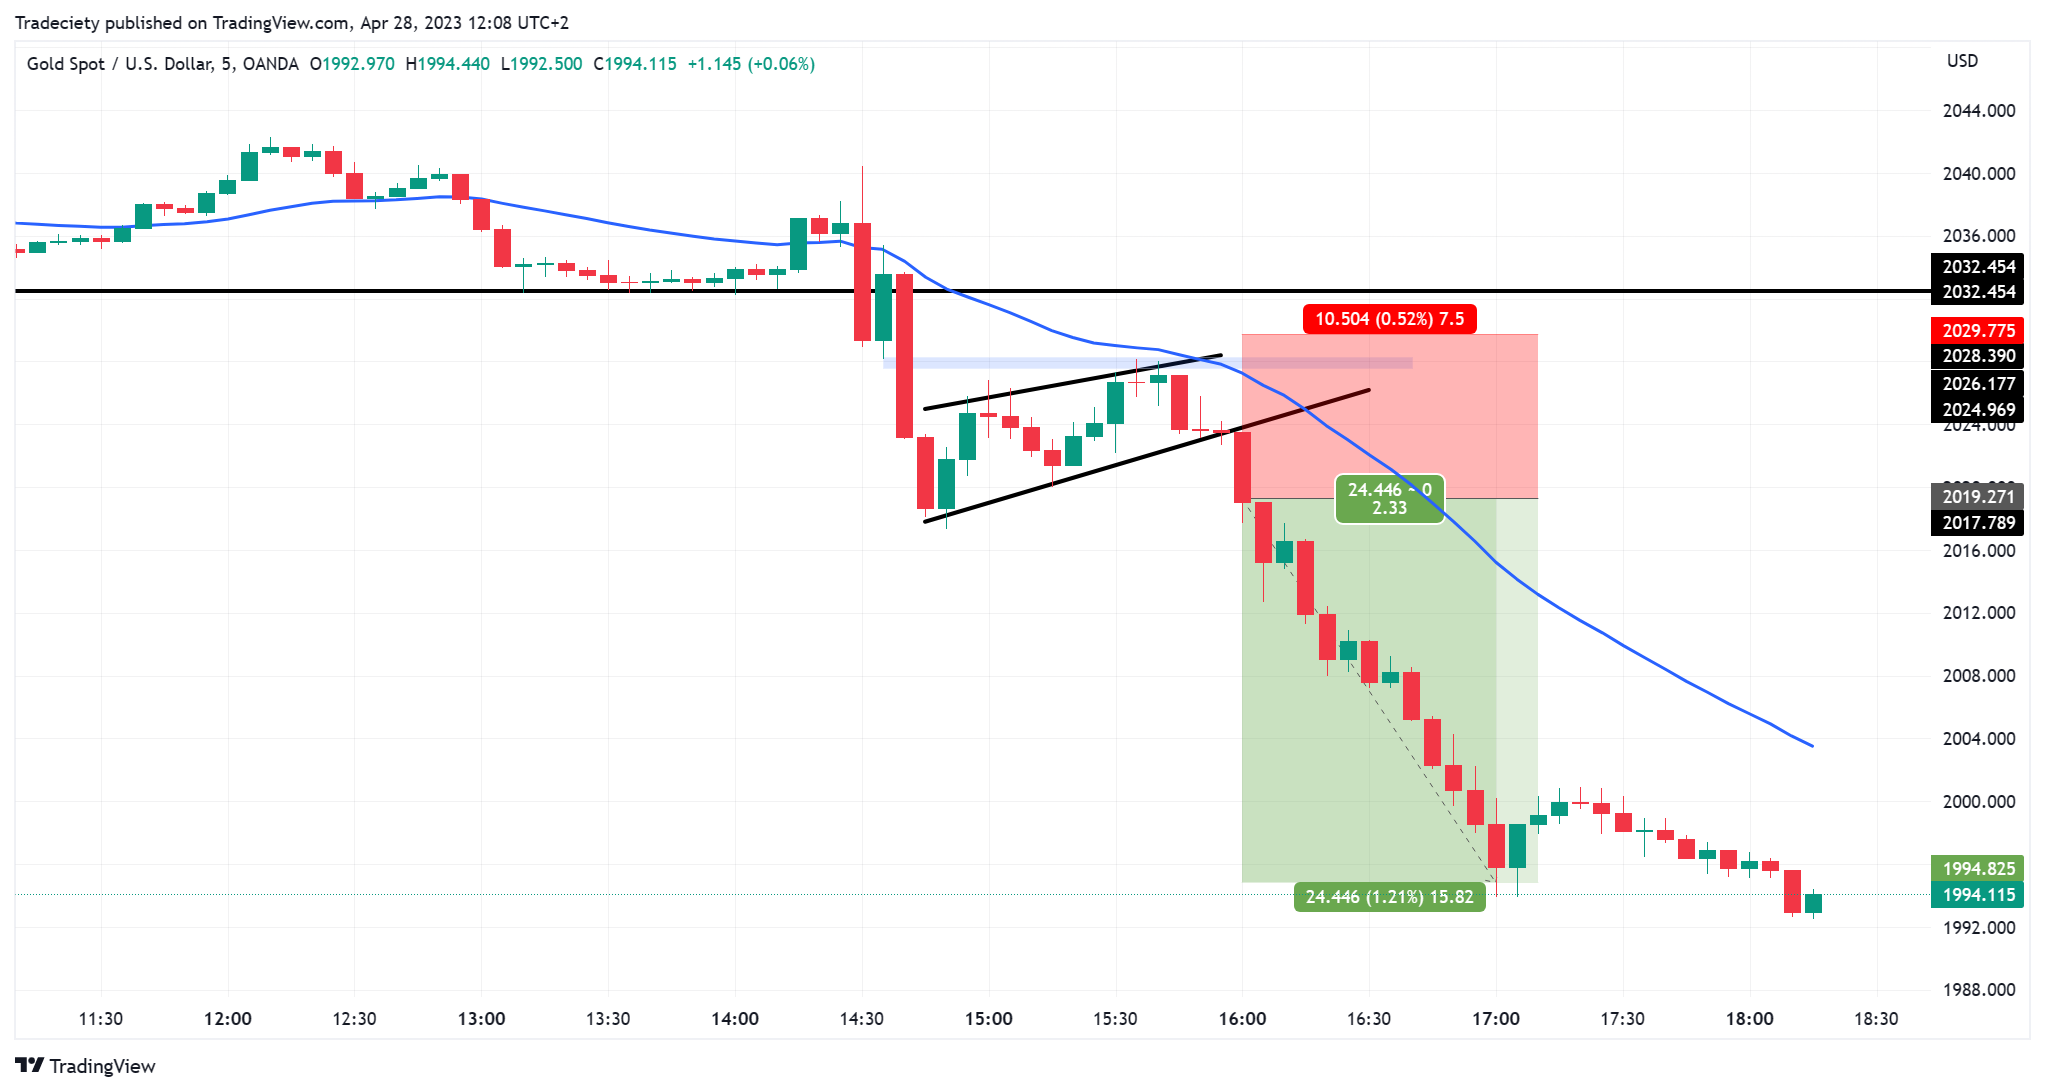
In strong trends, retests yield better reward-to-risk (1:2+ ratios common), per MT4 backtests on EUR/USD. Pullbacks shine in consolidation but suffer more whipsaws. Choose retests for breakout plays, pullbacks for continuations.
In particular, compare their edges.
- Retests confirm validity with volume on retest; pullbacks lack this filter.
- Retest stops sit tighter under the level versus pullback’s wider trendline buffers.
- Backtested data shows retests at 55% win rate vs. pullbacks’ 48% in majors.
How Do You Backtest a Retest Strategy Effectively?
Effective backtesting quantifies retest strategy viability using historical data tools like MT4 Strategy Tester or Forex Tester software, focusing on metrics such as win rate above 55%, profit factor over 1.5, and average reward-to-risk of 1:2. Manual replay on TradingView or Forex Tester simulates real conditions, marking 100+ historical retests across pairs. Automate rules: enter on retest candle close, exit at next level or trailing stop.
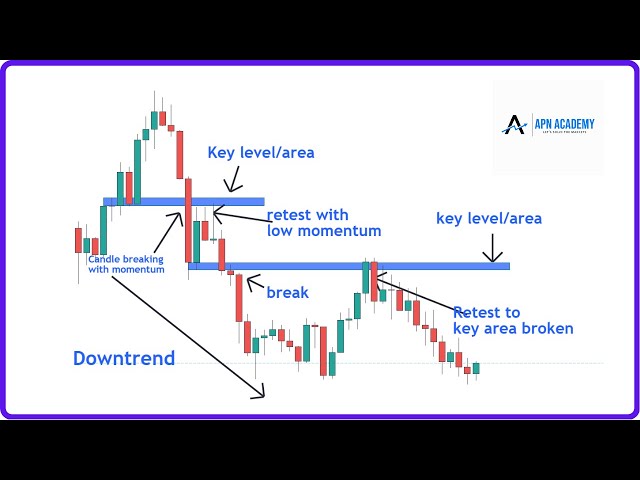
This process reveals tweaks, like adding RSI filters boosting expectancy by 30%. Track drawdowns under 10% for sustainability.
Moreover, optimize with key metrics.
- Calculate win rate as successful retests divided by total setups.
- Measure profit factor: gross profits over gross losses.
- Test across 5+ years of data to capture market cycles.
#### Which Forex Pairs Work Best for Retest Strategies?
Majors like EUR/USD excel for retest strategies due to high liquidity and reliable structure, outperforming exotics prone to erratic moves. EUR/USD’s tight spreads (under 1 pip) and central bank-driven trends produce clean retests, with H1 setups aligning daily levels effectively. GBP/USD follows suit with volatility for bigger moves.
Exotics like USD/TRY suffer wide spreads and gaps, distorting retests. Pair selection data from Myfxbook shows majors at 60% win rates versus exotics’ 42%.
To select wisely.
- Prioritize pairs with daily volume over 100 billion USD.
- Avoid exotics during low-liquidity hours.
- Test GBP/JPY for trending retests with wider stops.
What is the Role of False Breakouts in Retest Setups?
False breakouts act as critical traps preceding valid retest setups, teaching traders to filter with rejection candles and momentum divergence for avoidance. A false breakout occurs when price pierces a level briefly but reverses, trapping breakout chasers. True retests follow genuine breaks with pullback acceptance, confirmed by pinbar wicks or engulfing patterns at the level.

Advanced filtering uses tick volume spikes on rejection or MACD histogram contraction. Studies on Dukascopy data link 70% of false breaks to liquidity hunts before real moves.
Additionally, master trap avoidance.
- Demand multi-candle confirmation post-pierce before labeling a break.
- Filter with ATR: ignore breaks under 1x ATR for the timeframe.
- Pair with order blocks from higher timeframes for context.