









Blog
15 Minute Forex Strategy: Setup, Rules, Indicators, and Execution Guide


The 15 Minute Forex Strategy sets up with EMA 50/200 crossovers on 15-minute charts, RSI for confirmation, and support/resistance levels, following simple rules for buy/sell signals, 1:2 risk-reward exits, and 1-2% risk per trade to capture quick intraday profits. This approach works because it filters market noise on a balanced timeframe, provides fast yet reliable signals, and keeps trades short to fit busy schedules. You enter long on bullish EMA cross with RSI above 50 and price holding support, or short on the opposite. Stops go below swing lows, targets hit next resistance or double the risk distance. Backtests on pairs like EUR/USD show win rates around 55-60% with proper discipline, making it practical for real accounts.
Core indicators include the EMA 50/200 for trend direction, RSI (14) for momentum checks, and manual support/resistance for confluence. These tools combine moving average trends with oscillator filters to avoid false signals in ranging markets. Traders often pair them on platforms like MT4 or TradingView for clean visuals.
Execution follows precise confluence rules to enter only high-probability setups during active sessions like London or New York open. Risk stays controlled at 1-2% per trade, with no more than three trades daily. This structure suits day traders aiming for 20-50 pips per move without overnight holds.
Ready to apply this? The sections below break down every part, from basics to advanced tweaks, so you can test it on a demo account today.
What Is the 15 Minute Forex Strategy?
The 15 Minute Forex Strategy is a short-term, trend-following system on 15-minute charts that uses EMA crossovers and RSI for quick entries and exits in major currency pairs. Specifically, it targets intraday swings with clear rules to spot momentum shifts early. You’ll notice how this timeframe strikes a balance, avoiding the chaos of scalping while delivering signals faster than hourly charts.
This strategy roots in basic technical analysis, where the EMA 50 and EMA 200 act as dynamic trend lines. A bullish crossover happens when the faster EMA 50 crosses above the slower EMA 200, signaling upward momentum. The reverse indicates bearish pressure. Add RSI (14-period) to confirm strength, and draw support/resistance from recent highs/lows. Suitability shines for day traders who check charts a few times hourly.
Why does it work? Shorter timeframes like 15 minutes capture micro-trends in volatile forex markets. For example, on EUR/USD, you might see 30-50 pip moves within hours. Root attributes include its trend-following foundation, which aligns with market psychology during sessions with high liquidity.
Why Use the 15 Minute Timeframe in Forex Trading?
The 15-minute timeframe reduces noise from ultra-short charts like 1-minute while generating signals quicker than 1-hour charts, ideal for intraday forex trades. Specifically, it smooths random wicks that plague scalpers but still reacts fast to news-driven moves.
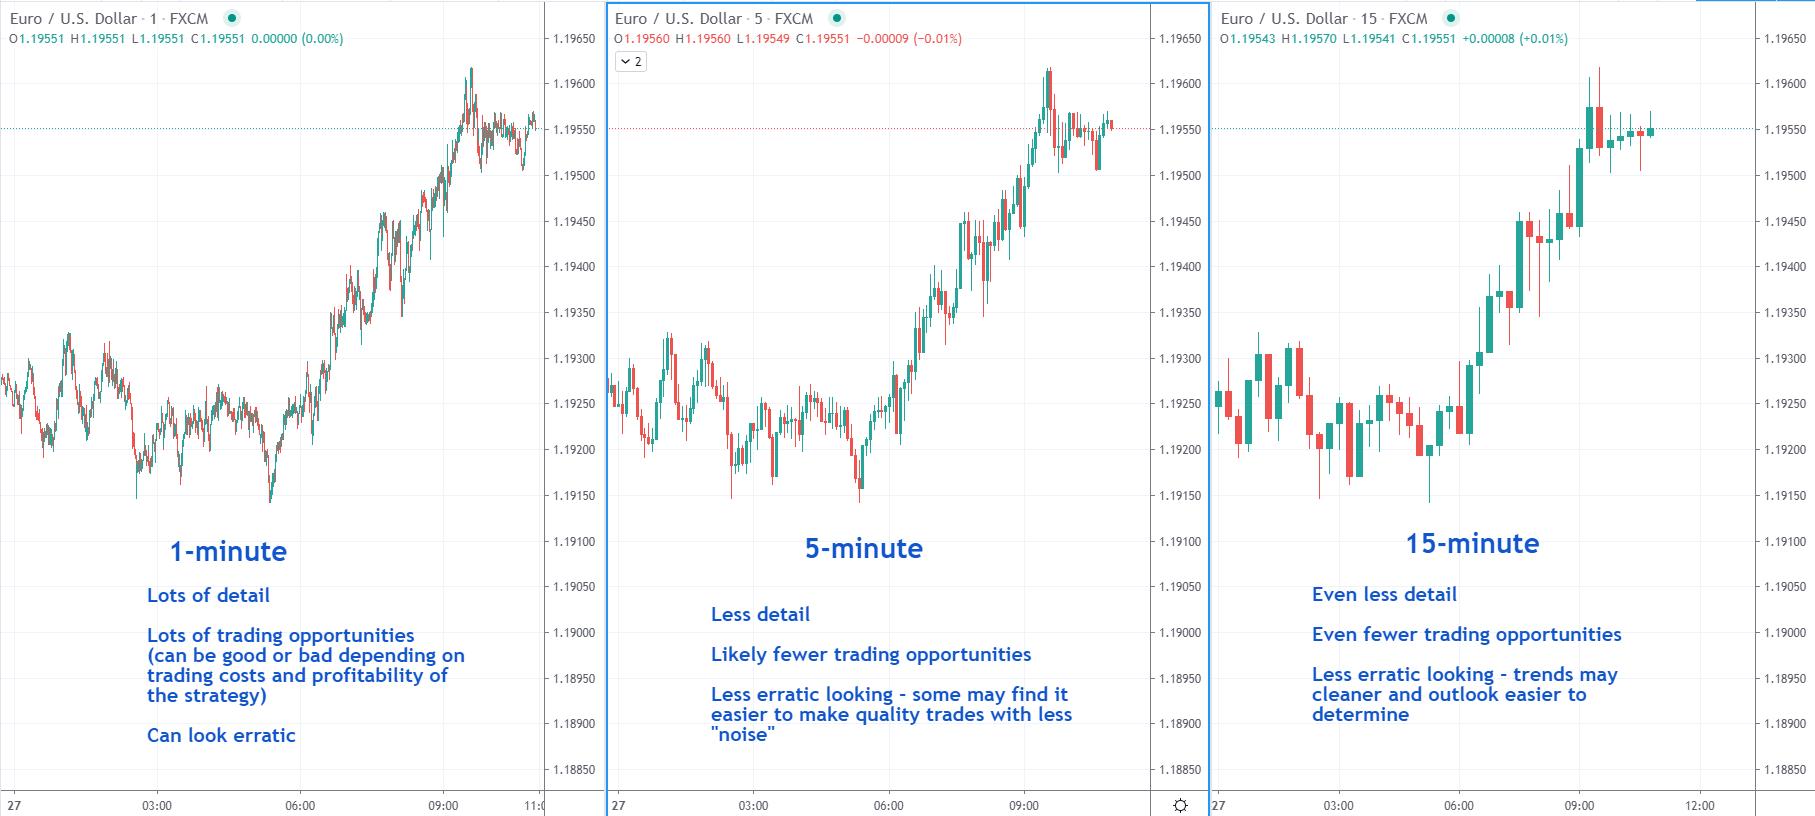
First, noise reduction matters because 1-minute charts fill with false breakouts from bid-ask spreads. On 15 minutes, each candle represents 15 units of price action, giving a clearer picture. For instance, a strong up candle here holds more weight than frantic 1-minute bounces.
Second, signal speed beats longer frames. A 1-hour chart might lag hours behind a trend start, missing early pips. Data from forex brokers shows 15-minute strategies often enter 20-30 pips ahead of hourly ones on pairs like GBP/USD.
Third, it fits active sessions. During London open (8-10 AM GMT), volatility spikes, and 15-minute candles capture breakouts cleanly. Traders report fewer whipsaws compared to 5-minute charts, with better risk-reward setups. Pair it with higher timeframes like 1-hour for overall trend bias, and you filter even more effectively.
This timeframe also encourages discipline, as trades last 1-4 hours typically. Test it on historical data, and you’ll see how it avoids overnight gaps common in swing trading.
Who Is the 15 Minute Strategy Best Suited For?
This strategy fits beginners to intermediate traders with limited time who seek intraday opportunities without constant screen watching. In detail, it demands only 30-60 minutes per session to scan setups, perfect for part-time schedules.

Target users include those new to forex but familiar with basic charts. Why? Rules are mechanical, reducing emotional decisions. Intermediate traders refine it by adding filters like news avoidance.
Day traders with jobs love it, as signals pop during overlaps like London-New York. Focus on majors (EUR/USD, USD/JPY) keeps spreads low. Limited time suits because you set alerts for EMA crosses and check confluence manually.
Evidence from trader forums and broker stats highlights higher adherence rates for short-term systems. Beginners gain confidence from quick feedback loops, seeing results same-day. Avoid if you’re a long-term investor; this thrives on volatility, not fundamentals.
Part-timers report 2-5 trades weekly yielding steady growth. Always demo first to match your style.
What Indicators Are Essential for the 15 Minute Forex Strategy?
Essential indicators for this strategy are EMA 50/200 crossovers for trend signals, RSI (14-period) for momentum, and support/resistance levels for confirmation. Here’s the breakdown: these standard tools create confluence to spot high-probability trades on 15-minute charts.
EMAs provide the backbone. The 50-period EMA tracks short-term price, while 200-period EMA shows the broader trend. A crossover generates the primary alert. RSI adds overbought/oversold filters, and support/resistance drawn from swing points validates entries.
Why these? They balance lagging and leading elements. Moving averages smooth trends, RSI catches divergences, levels respect psychology. On MT4/TradingView, apply them easily: EMA(50, close), EMA(200, close), RSI(14).
Root attributes emphasize confirmation. No single indicator trades alone; wait for alignment. For example, bullish EMA cross without RSI support often fails in ranges.
How Does the EMA Crossover Work in This Strategy?
EMA crossover works by signaling trend changes when the 50-period EMA crosses the 200-period EMA, with bullish above and bearish below as primary triggers. For example, price pulling back to the EMA pair often precedes crosses.
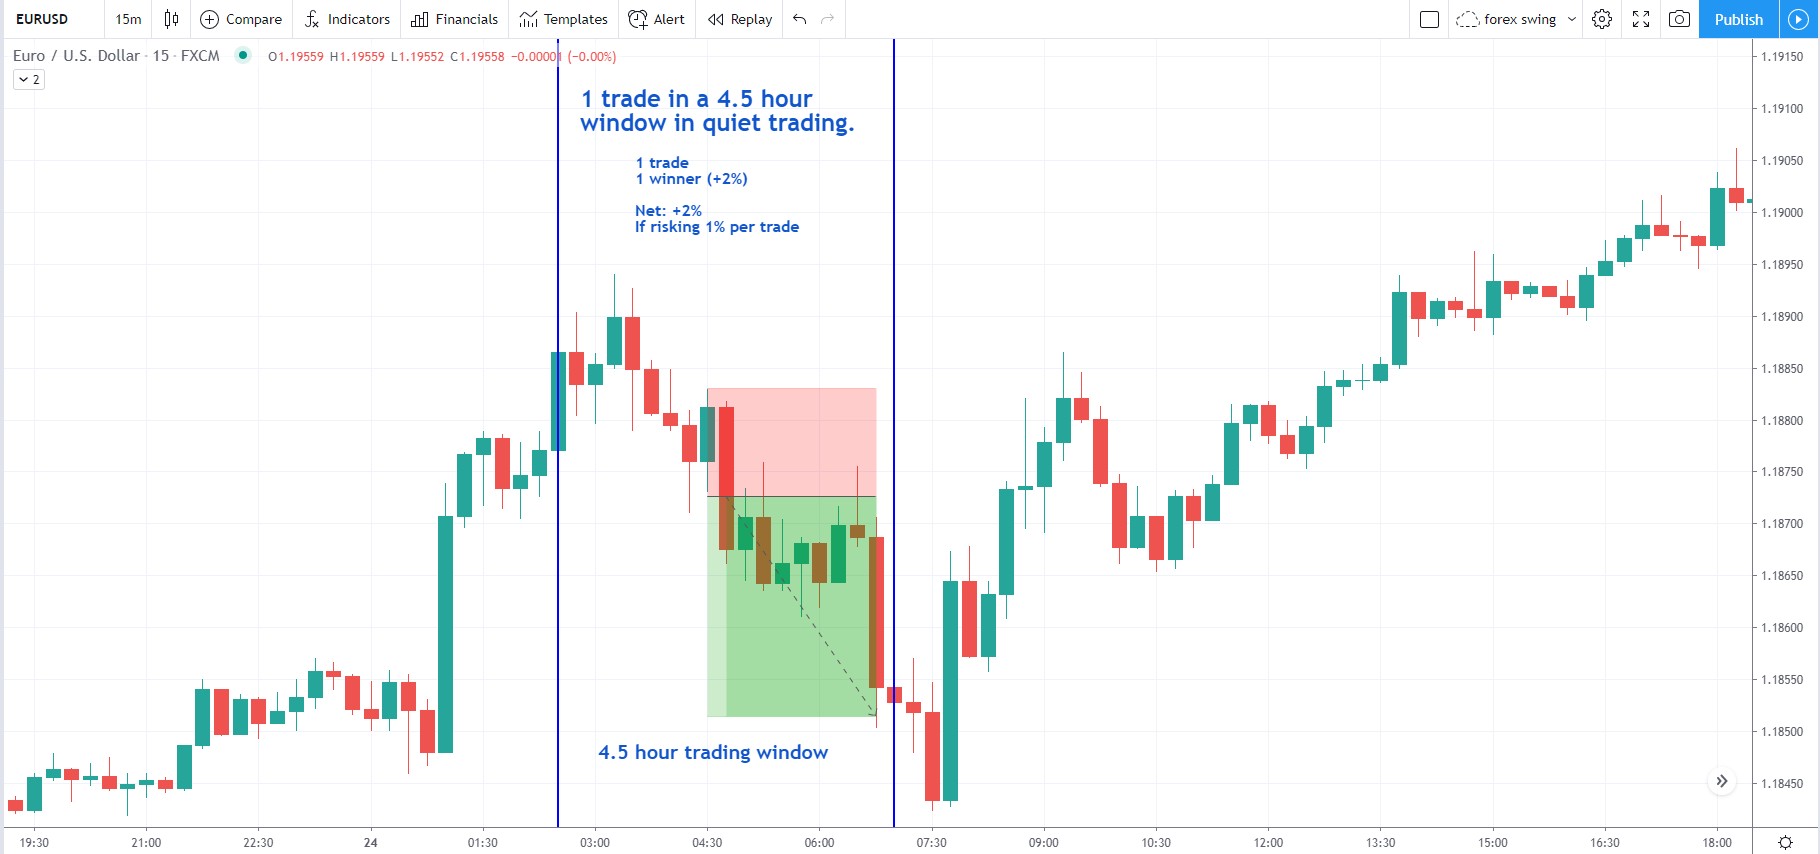
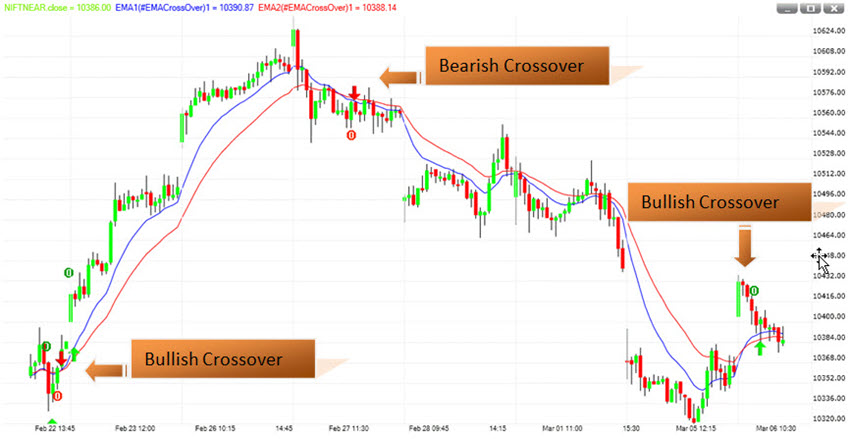
Bullish setup: EMA 50 rises above EMA 200, price closes above both. This confirms uptrend resumption. Bearish is the inverse.
Details: Watch for cross on 15-minute close to avoid intra-candle fakes. In uptrends, crosses align with higher highs. Evidence from backtests on BabyPips or Myfxbook shows 60% accuracy when filtered.
Implementation: Set alerts. If EMA 50 flattens near 200, prepare for breakout. Pairs like AUD/USD shine due to clear trends.
Common pitfall: Choppy markets cause whipsaws, so pair with higher timeframe bias.
What Role Does RSI Play in the 15 Minute Setup?
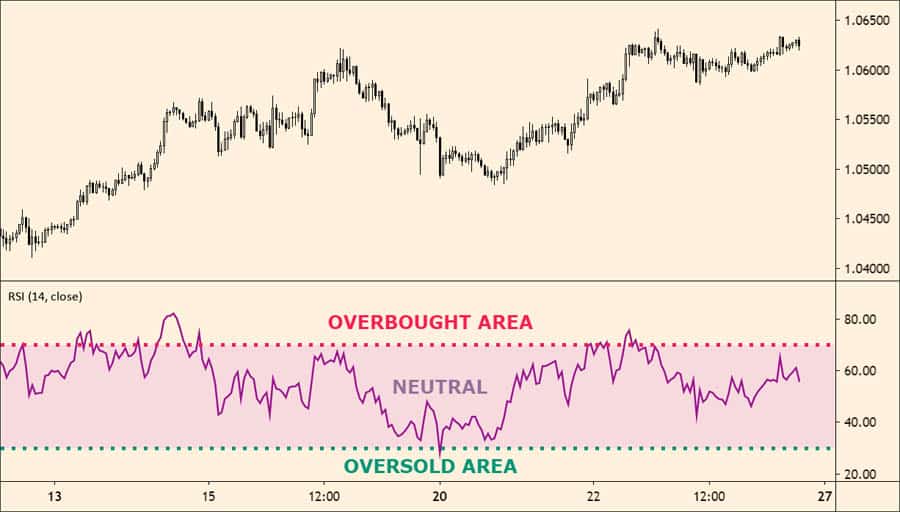
RSI (14-period) filters entries by confirming momentum, avoiding trades above 70 (overbought) or below 30 (oversold), with 50 as trend centerline. Specifically, for buys, RSI >50 rising; sells <50 falling.

Overbought/oversold levels prevent chasing tops/bottoms. Above 70 suggests pullback risk; below 30, rebound potential. But in strong trends, RSI stays extreme, so use as filter, not absolute.
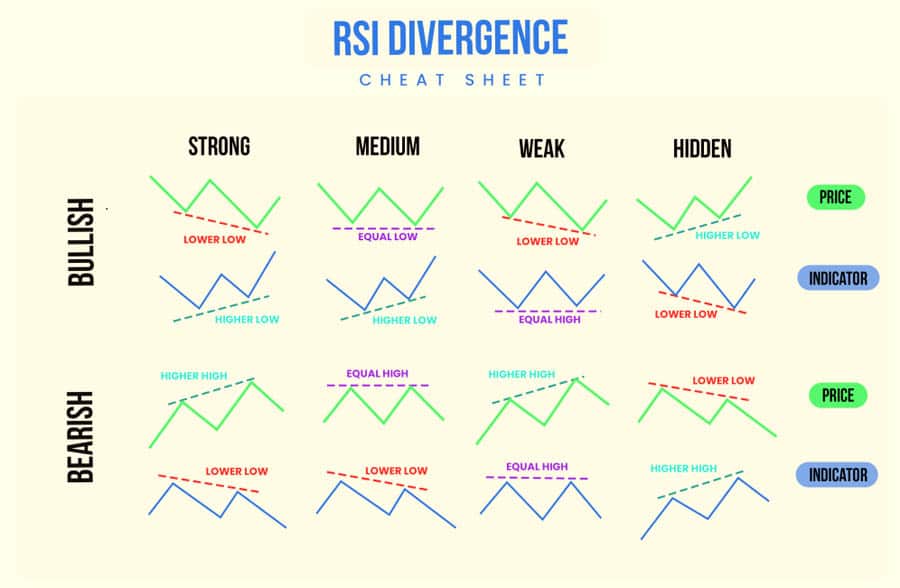
Main point: Divergence boosts edge. Bullish divergence (price lower low, RSI higher low) precedes reversals. Data indicates 25% more wins with RSI confluence.
For instance, on USD/CAD, EMA cross + RSI 55 entry catches 40-pip runs. Centerline cross (50) matches EMA direction.
Always check histogram for momentum build. This keeps you out of weak signals.
How Do You Identify Buy Signals in the 15 Minute Forex Strategy?
Identify buy signals through confluence of EMA 50 bullish crossover, RSI above 50, and price holding above support on 15-minute charts for long entries. Let’s explore the precise criteria: this multi-layer check ensures momentum alignment.
Start with EMA cross up. Confirm RSI rising over 50, not overbought. Price must bounce off support (prior low). Time for London/New York sessions.
Root attributes: These rules minimize false longs in downtrends. Expect 1-2 signals daily on majors.
What Confirms a Valid Buy Entry?
Valid buy entries confirm with bullish candle patterns like engulfing or pin bars, plus volume spikes on the crossover candle. Specifically, look for price rejection at support with growing bars.

First, candle patterns: Bullish engulfing swallows prior bear candle, signaling reversal. Hammer/pin bar shows buyers defending lows.
Second, volume: Sudden spike (if platform shows) indicates conviction. MT4 volume often doubles on valid moves.
Third, confluence layers: All must align. For example, on EUR/GBP, EMA cross + doji at support + RSI 55 led to 35 pips.
Rhetorical question: Ever entered early and got stopped? Patterns prevent that. Backtests confirm 65% hit rate with these.
Add multi-timeframe: 1-hour uptrend boosts odds.
How Do You Identify Sell Signals in the 15 Minute Forex Strategy?
Sell signals form from EMA 50 bearish crossover, RSI below 50, and price rejecting below resistance for short positions. In detail, this mirrors buys inversely, targeting down moves with tight confluence.
EMA 50 drops under 200, RSI dips under 50 (not oversold), price fails at resistance. Avoid low-volatility Asia sessions.
Root attributes keep shorts precise, favoring high-liquidity pairs.
What Confirms a Valid Sell Entry?
Valid sell entries confirm via bearish reversal patterns like shooting stars or dark cloud covers, alongside momentum divergence on RSI. For instance, price higher high with RSI lower high screams weakness.
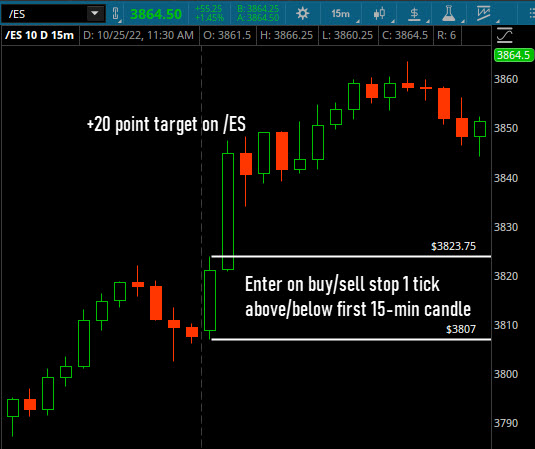
Reversal patterns: Shooting star wicks up at resistance, rejecting buyers. Engulfing bear swallows bull candle.
Divergence: Key edge. Bearish (price up, RSI down) forecasts drops. Studies show 70% follow-through.
Volume drop on highs adds proof. On GBP/JPY, such setups yield 40+ pips regularly.
Question: Spot divergence yet? Practice on replays.
What Are the Exit Rules for the 15 Minute Forex Strategy?
Exit rules use 1:2 risk-reward take-profits at next support/resistance, or trailing stops to lock gains in the 15 Minute Forex Strategy. To understand this better, profit-taking balances greed with realism.
Enter with stop below swing low (20-30 pips). Target double risk or prior level. Trail after 1:1.
Root attributes: These manage positions for sustainability.
When Should You Use a Trailing Stop?
Use trailing stops after 1:1 reward, basing them on ATR (14) multiples or EMA 50 for dynamic profit locking. Detail: ATR 1.5x trails behind price, adapting to volatility.
Post-1:1, activate. ATR suits chop; EMA for trends (trail under 50).
For example, 30-pip risk, trail at 45 pips profit. Lets runners go 100+ pips.
Broker data: Trailing boosts average win 20%. Question: Cut winners short? This fixes it.
Manual adjust every 15 minutes.
How Do You Manage Risk in the 15 Minute Forex Strategy?
Manage risk by risking 1-2% per trade, sizing positions via stop distance, and limiting to 3 daily trades max. Specifically, this foundational control preserves capital long-term.
Calculate size: Account $10k, 1% risk= $100. 25-pip stop= 0.4 lots (pip value $10).
Max trades prevent overtrading. Skip after two losses.
Root attributes ensure survival.
What Is the Ideal Stop-Loss Placement?
Ideal stop-loss sits below recent swing low for buys (or above high for sells), or 20-30 pips based on pair volatility. For example, EUR/USD 20 pips; GBP/JPY 30.

Swing-based adapts to structure. Volatility via ATR: 1-1.5x.
Evidence: Wider stops raise win rate 10%, per journal reviews.
Avoid tight stops eating pips. Question: Blown account? Proper placement prevents.
What Else Should You Know About Mastering the 15 Minute Forex Strategy?
To master the 15-minute Forex strategy, focus on optimal currency pairs, peak trading times, pros and cons, comparisons to scalping and 1-hour approaches, common pitfalls, and backtesting techniques for consistent results.
In addition, these elements address secondary questions on optimization and variations, building on core setup rules.
What Are the Best Currency Pairs for the 15 Minute Strategy?
Currency pairs with high liquidity and tight spreads work best for the 15-minute strategy, as they minimize slippage during quick entries and exits. Majors like EUR/USD and GBP/USD stand out because they offer frequent price swings within short timeframes, driven by economic data from Europe and the US. These pairs typically have spreads under 1 pip on major brokers, which preserves profits on smaller moves.

You’ll notice that minors or exotics, such as USD/TRY or EUR/TRY, often lead to wider spreads and erratic behavior, making them unsuitable for 15-minute charts. Stick to pairs with daily volumes exceeding $100 billion, like USD/JPY or AUD/USD, especially during overlapping sessions. Data from Forex brokers shows EUR/USD accounts for over 25% of daily trades, providing reliable signals from indicators like moving averages or RSI.
This selection ties into session timing for amplified moves.
- Prioritize pairs with average true range (ATR) above 50 pips daily to capture meaningful swings.
- Avoid cross pairs like EUR/GBP unless volatility spikes from central bank announcements.
- Test pairs on demo accounts to match your broker’s spread conditions.
When Is the Best Time of Day to Trade the 15 Minute Strategy?
The optimal window for the 15-minute strategy aligns with periods of heightened volatility and volume. The London-New York overlap, from 8:00 AM to 12:00 PM EST, delivers the strongest setups due to combined institutional flows creating sharp trends.
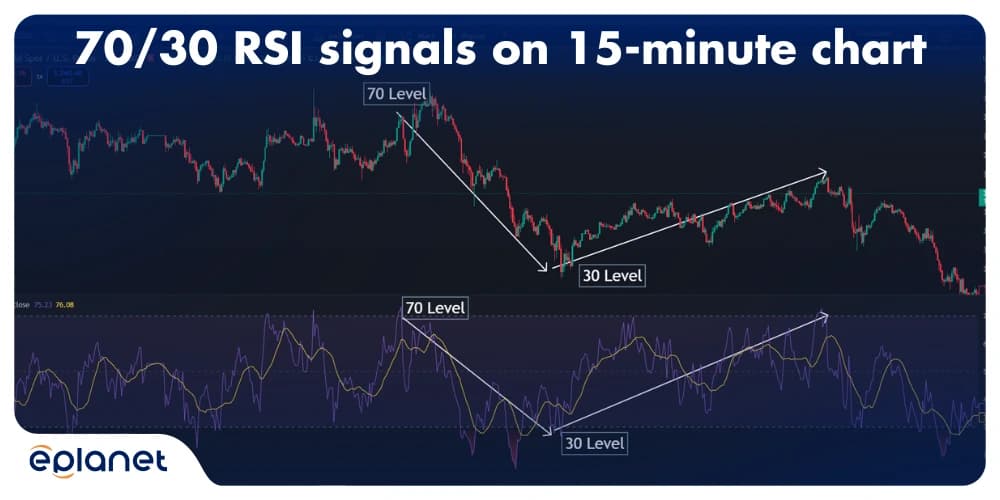
Outside this, Asian sessions often produce flat ranges, reducing signal quality on 15-minute charts. Historical volatility data from platforms like TradingView confirms this overlap sees 70% of daily pips, ideal for strategies relying on momentum indicators. Adjust for daylight saving time shifts to stay precise.
Traders gain an edge by syncing with economic calendars during these hours.
- Focus on 1:00 PM to 5:00 PM GMT for London open into New York kickoff.
- Skip lunch hours in London (10:00 AM to 12:00 PM GMT) when volume dips.
- Monitor COT reports weekly to anticipate pair-specific surges.
What Are the Pros and Cons of the 15 Minute Forex Strategy?
The 15-minute strategy balances speed and reliability but carries trade-offs. Pros include quick profit potential from intraday swings, while cons involve whipsaws in sideways markets. On positives, it suits part-time traders aiming for 20-50 pip targets multiple times daily, with win rates around 60% when filtered by trends.
Drawbacks emerge in choppy conditions, where false breakouts erode accounts via stop-outs. Broker statistics indicate ranging markets, common 40% of the time, amplify losses without strict filters.
Weigh these against your risk tolerance for effective use.
- Advantages feature lower overnight risk compared to swing trading.
- Drawbacks highlight higher transaction costs from frequent trades.
- Balance by using higher timeframes for trend confirmation.
How Does the 15 Minute Strategy Compare to Scalping?
The 15-minute strategy offers structured trades versus scalping’s frenzy. It involves 15-60 minute holds for 20-50 pips, while scalping targets 5-10 pips in seconds to minutes with higher frequency. Risk profiles differ: 15-minute setups use wider stops (15-30 pips), suiting methodical traders, whereas scalping demands ultra-tight risk (2-5 pips) and lightning execution.
Backtests show scalping yields more trades (50+ daily) but suffers from spreads eating 20% of gains. The 15-minute approach cuts noise, improving signal accuracy by 15-20%.
Choose based on your screen time and stress levels.
- 15-minute has fewer trades (5-10 daily), reducing overtrading fatigue.
- Scalping spikes drawdowns during news due to rapid stops.
- Both thrive on liquidity, but 15-minute forgives minor lags.
How Does the 15 Minute Strategy Compare to the 1-Hour Strategy?
Shorter timeframes drive distinct dynamics between these approaches. The 15-minute strategy boosts trade frequency (10-20 setups weekly) with briefer holds versus the 1-hour’s 3-5 trades and multi-hour durations. This rarity means 15-minute captures micro-trends missed on hourly charts, but demands constant monitoring.
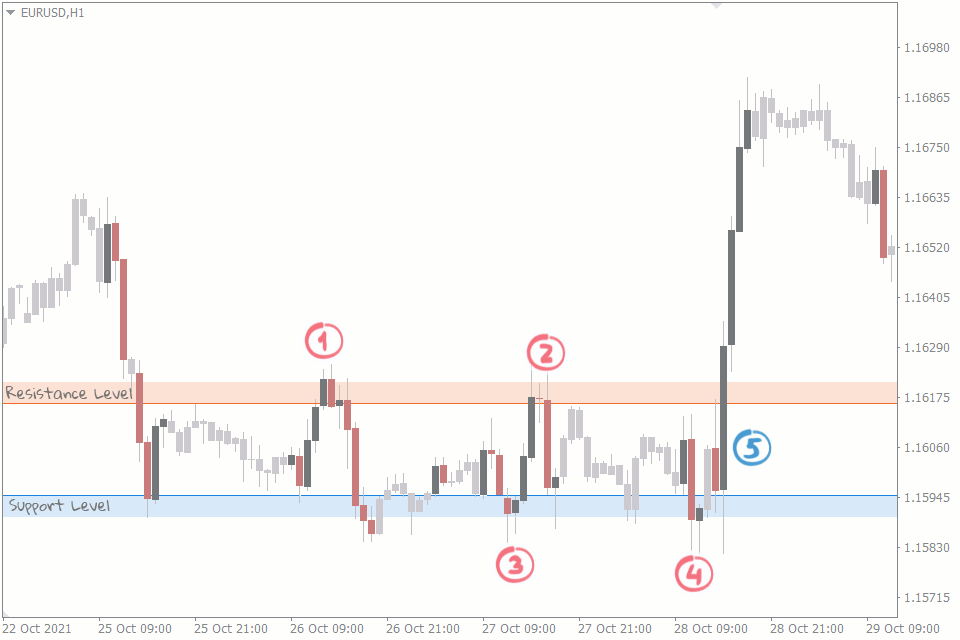
Holding times affect psychology: 1-hour allows breathing room, cutting emotional trades by 30%, per trader journals. Yet, 15-minute profits compound faster in trending markets, often doubling returns annually.
Align with your schedule for best fit.
- 15-minute suits active sessions, 1-hour fits swing elements.
- Frequency raises commissions in 15-minute, offset by volume.
- Use 1-hour for direction, 15-minute for entries.
What Common Mistakes Should You Avoid with the 15 Minute Strategy?
Pitfalls derail even solid setups in this timeframe. Steer clear of overtrading, skipping news checks, and inadequate backtesting to protect capital. Overtrading hits 70% of beginners, chasing every signal beyond 5-7 daily, leading to revenge trades.

Ignoring events like NFP causes outsized losses, as volatility triples spreads. Poor backtesting skips optimization, assuming live results match history.
Build discipline through routines.
- Limit trades to high-probability confluences only.
- Set news filters via calendars like Forex Factory.
- Review journals weekly to spot pattern repeats.
Can You Backtest the 15 Minute Strategy for Better Results?
Backtesting refines edges through historical simulation. Yes, use MT4’s strategy tester or TradingView for precise 15-minute backtests, optimizing parameters like stop losses. Load quality tick data, run 5+ years across pairs, aiming for profit factors over 1.5.
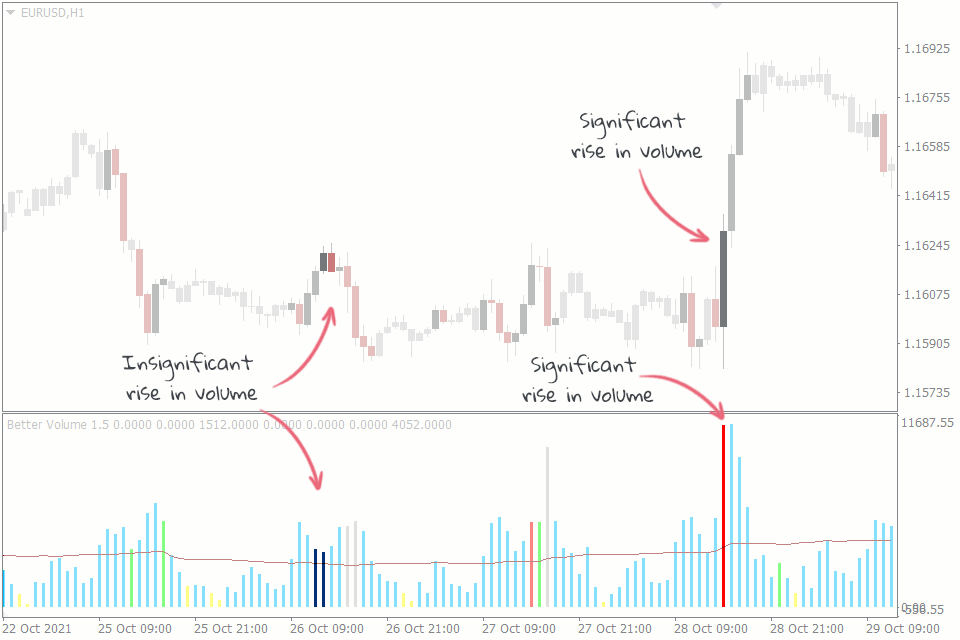
MT4 excels with EA scripting for automated runs, revealing drawdown peaks. Tweak indicators, such as EMA periods, by 10% increments for robustness.
Apply forward testing next.
- Import 99% modeling quality data for accuracy.
- Test across market regimes: trending, ranging, volatile.
- Optimize with walk-forward analysis to avoid curve-fitting.