









Blog
Chart Patterns in Forex: Types, Identification, and Trading Strategies

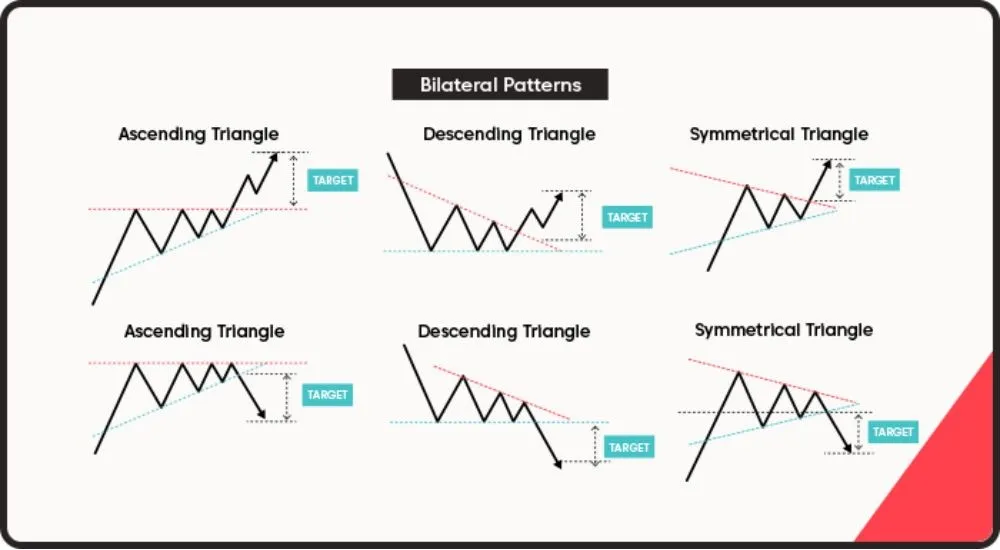
Chart patterns in Forex represent visual shapes formed by price movements on charts, signaling likely reversals or continuations of trends to guide trading decisions through types like head and shoulders or flags, identification via candlesticks, and strategies with defined entries and risk rules. These patterns emerge from the collective behavior of market participants, reflecting shifts in supply and demand. Traders use them within technical analysis to forecast price direction without relying solely on fundamentals. By recognizing these formations early, you position yourself to enter trades with higher probability outcomes. Common patterns appear across currency pairs like EUR/USD or GBP/JPY, making them accessible on platforms such as MetaTrader 4 or TradingView.
Forex chart patterns fall into two main groups: reversal patterns that signal trend changes and continuation patterns that indicate ongoing momentum. Reversal types, such as double tops, mark exhaustion points where buyers or sellers lose control. Continuation patterns, like triangles, form during brief pauses in strong trends. This classification helps traders anticipate market behavior based on historical price action.
You identify chart patterns by scanning candlestick charts for specific shapes, confirming with volume and support levels across multiple timeframes. Start with higher timeframes for reliability, then zoom in for precision. Tools like trendlines and Fibonacci retracements aid in validation, reducing false signals.
These elements form the foundation for profitable Forex trading. Now, explore each aspect in depth to build your skills step by step.
What Are Chart Patterns in Forex Trading?
Chart patterns in Forex trading are visual formations created by price action on candlestick or line charts that indicate potential trend reversals or continuations, rooted in technical analysis principles. Let’s explore their foundational role in more detail.
Chart patterns arise from the psychology of traders reacting to news, economic data, and sentiment in the 24/5 Forex market. They capture moments when bulls and bears battle for dominance, leaving traceable footprints on charts. For instance, a bullish engulfing pattern shows buyers overwhelming sellers after a downtrend, hinting at an upward reversal.
You will notice these patterns repeat across pairs like USD/JPY because human behavior drives markets universally. Their power lies in probability, not certainty. Studies from sources like the CMT Association show patterns confirmed by volume succeed 60-70% of the time in trending markets.
In practice, patterns serve multiple uses. They help set entry points, gauge trend strength, and even estimate price targets. A classic example is the head and shoulders, where the middle peak exceeds others, signaling a top. Measure the distance from head to neckline for target projection.
Traders integrate patterns with indicators like RSI for overbought/oversold confirmation. On daily charts of AUD/USD, a double bottom often precedes rallies as price tests support twice before breaking higher.
Why do they matter in Forex specifically? The market’s high liquidity amplifies clean formations, unlike stocks with gaps. Patterns also adapt to volatility spikes from events like Non-Farm Payrolls.
To apply them, draw trendlines connecting highs or lows. A breakout above resistance with increased volume validates the signal. Backtesting on historical data reveals patterns perform best in ranging or trending conditions, not choppy sideways moves.
Real-world traders like those at hedge funds scan for inverse head and shoulders on 4-hour charts for quick scalps. Always combine with context: a pattern near key levels like 1.3000 on EUR/USD carries more weight.
Patterns evolve with algorithms, but core shapes persist. Practice on demo accounts to internalize them. Over time, you spot nuances, like slight asymmetries that still work.
This foundation sets the stage for classifying and spotting them effectively.
What Are the Main Types of Chart Patterns Used in Forex?
There are two main types of chart patterns in Forex: reversal patterns like head and shoulders and double tops/bottoms, and continuation patterns like flags and triangles, grouped by their signal of trend change or persistence. Here’s the breakdown of this core classification system.
Reversal and continuation categories stem from trend dynamics. Reversals form at exhaustion points, while continuations pause trends briefly.
What Are Reversal Chart Patterns in Forex?
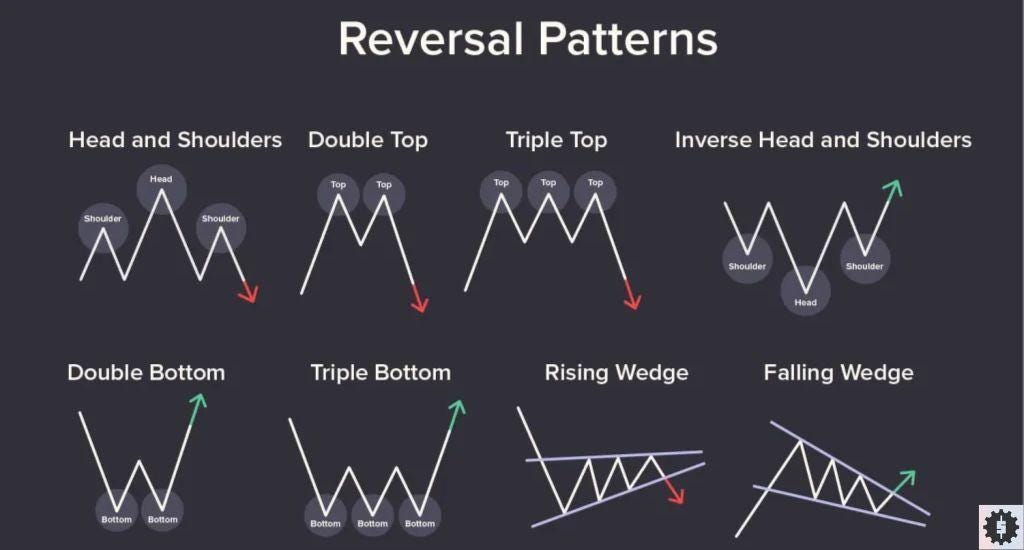
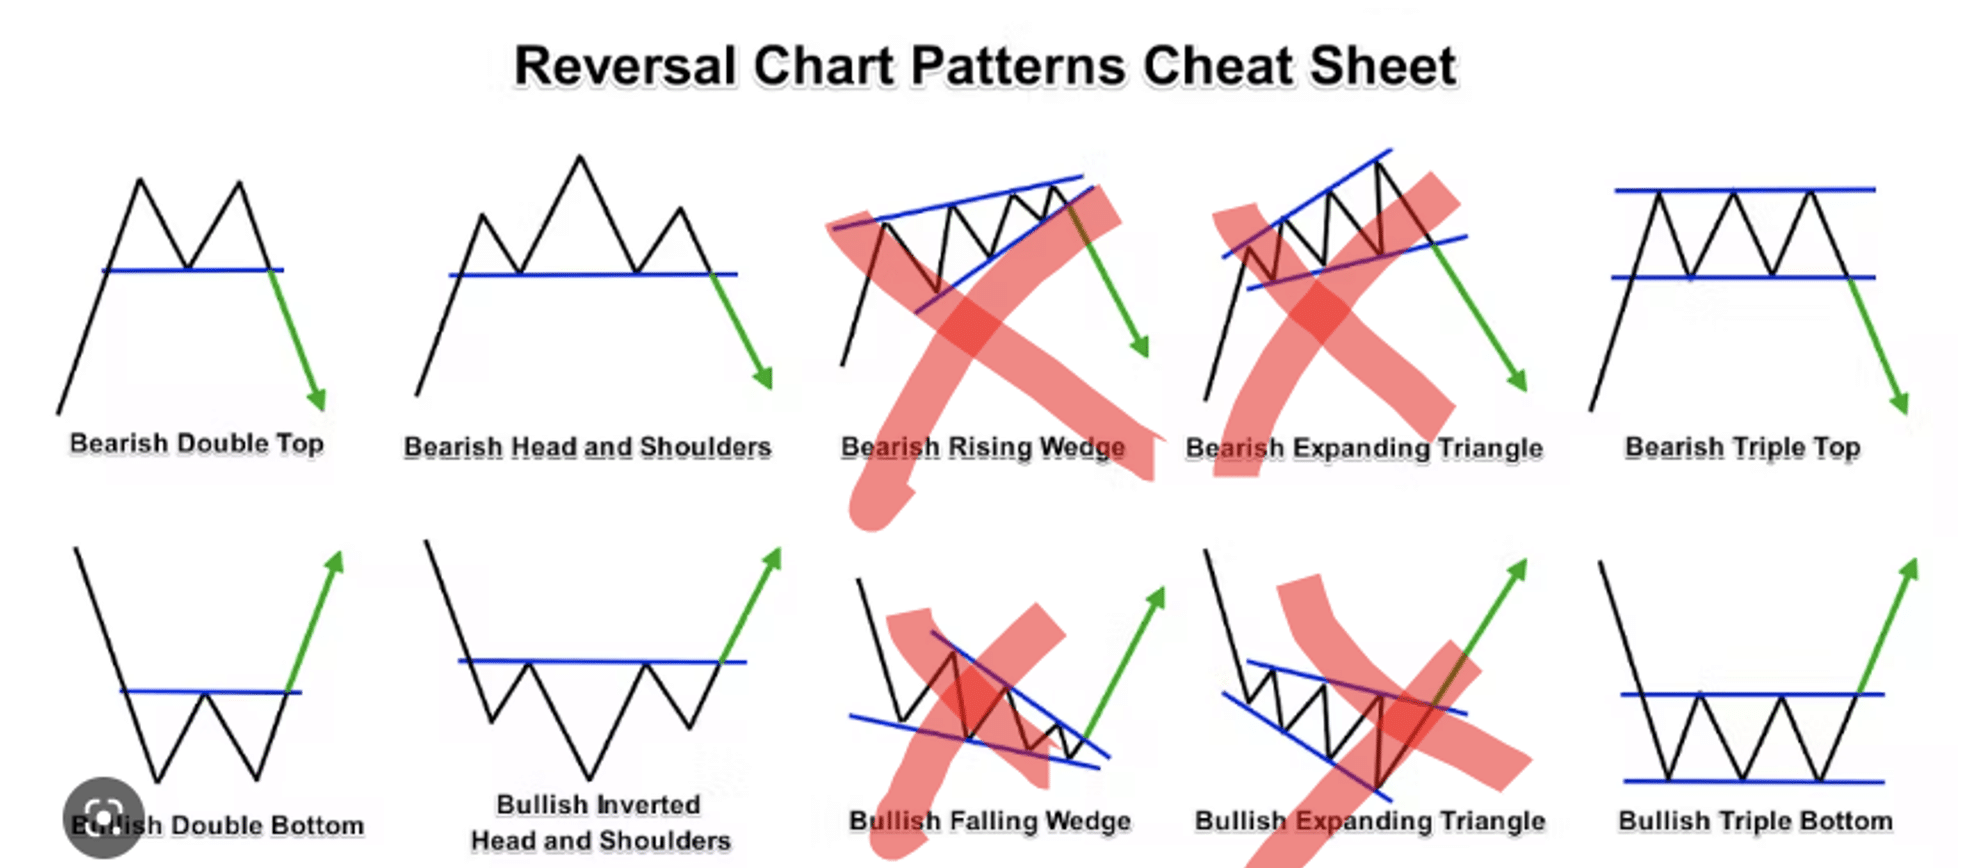
Reversal chart patterns in Forex, such as head and shoulders, double top/bottom, and triple top/bottom, signal an end to the current trend and start of the opposite direction through failed higher highs or lower lows. Specifically, these patterns highlight shifts in momentum.
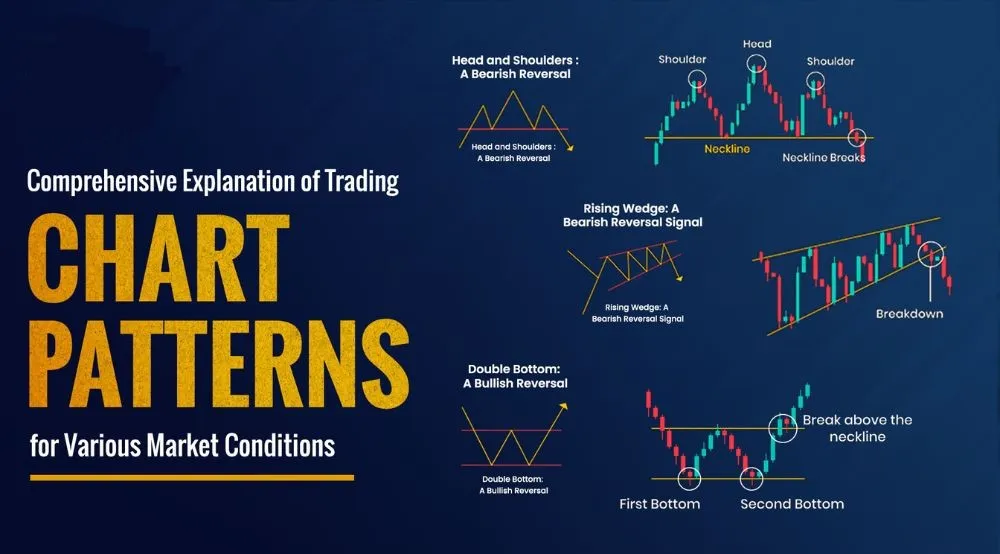
Take the head and shoulders: three peaks with the middle highest, neckline as support. A break below targets the head-to-neckline distance downward. On GBP/USD daily charts, this appeared before the 2022 downtrend, confirmed by declining volume on the right shoulder.
Double top resembles an “M,” with price failing to exceed resistance twice. Enter short on neckline break. Evidence from BabyPips studies shows 65% success with volume divergence.
Double bottom, an “W,” signals bullish reversal. Price tests support twice, then rallies. Triple variations add confirmation but take longer.
These patterns shine in Forex due to round-the-clock trading, forming cleanly. For example, an inverse head and shoulders on USD/CAD in 2023 preceded a strong upmove.
Use them after prolonged trends. Draw neckline precisely; false breaks occur without volume.
Traders measure targets: from breakout point subtract pattern height. Combine with MACD crossovers for edges.
What Are Continuation Chart Patterns in Forex?
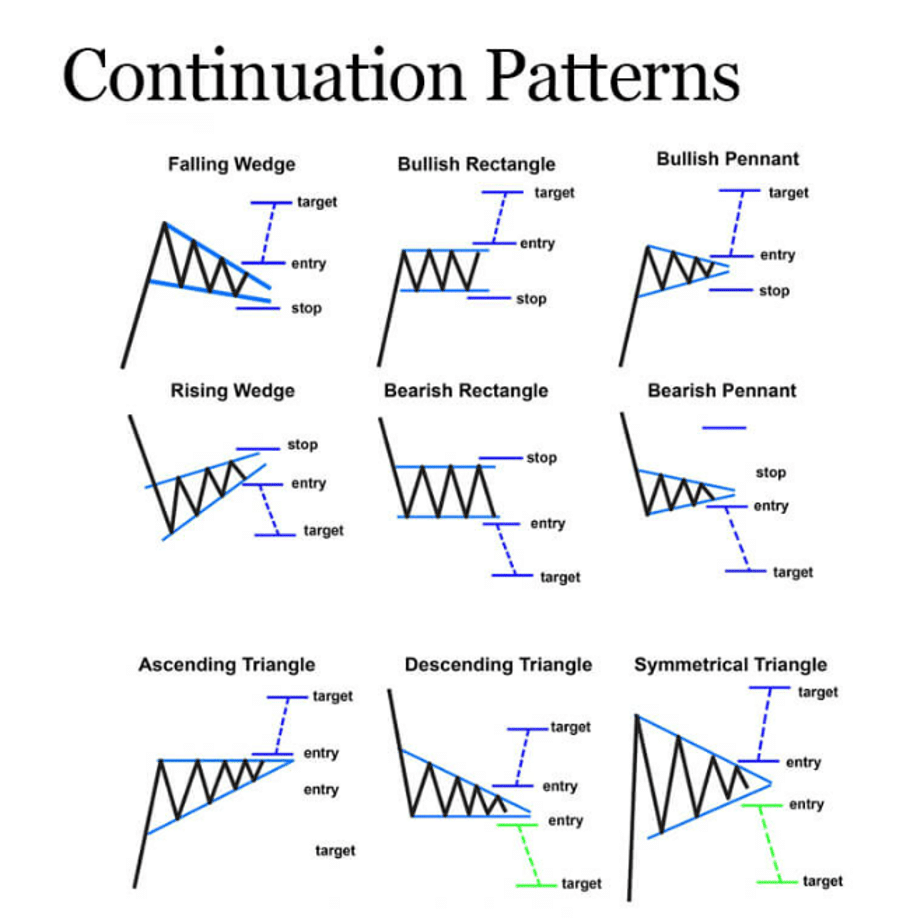
Continuation chart patterns in Forex, including flags, pennants, and triangles, indicate a brief consolidation before the prevailing trend resumes, characterized by converging lines or parallel channels. For instance, they form during pullbacks in strong moves.
Flags appear as rectangular consolidations against the trend, sloping opposite to the advance. Bullish flags have downward channels after uptrends. Breakout upward matches pole length.
On EUR/JPY 1-hour charts, flags often follow news-driven spikes, resuming with volume.
Pennants are small symmetrical triangles after sharp moves, tightening over 5-15 bars. Break in trend direction projects equal to the pole.
Triangles come in ascending (bullish), descending (bearish), and symmetrical. Symmetrical ones consolidate before breakout, either way but favoring the prior trend.
Ascending triangles have flat resistance and rising lows, ideal for Forex uptrends like NZD/USD rallies.
Confirmation requires breakout on above-average volume. Measure targets from base to apex.
These patterns thrive in Forex’s trending pairs, per FXCM data showing 70% continuation in majors.
Avoid trading inside; wait for closes beyond boundaries. They shorten trends, offering quick trades.
This grouping equips you to categorize patterns quickly. Next, learn to spot them.
(Total for this H2: 582)
How Do You Identify Chart Patterns on Forex Charts?
Identify chart patterns on Forex charts through a 5-step process: select timeframe, draw trendlines, check symmetry and volume, confirm breakout, and project targets, leading to high-confidence setups. To understand this better, follow the practical steps.
Start with clean candlestick charts on MT5. Scan left to right for emerging shapes.
What Timeframes Are Best for Spotting Forex Chart Patterns?
Daily and 4-hour charts offer the best reliability for spotting Forex chart patterns, as they filter noise while capturing institutional moves, outperforming intraday for beginners. Daily charts suit swing traders, showing patterns like head and shoulders over weeks.
4-hour balances detail and trend, ideal for EUR/USD flags during London-New York overlap.
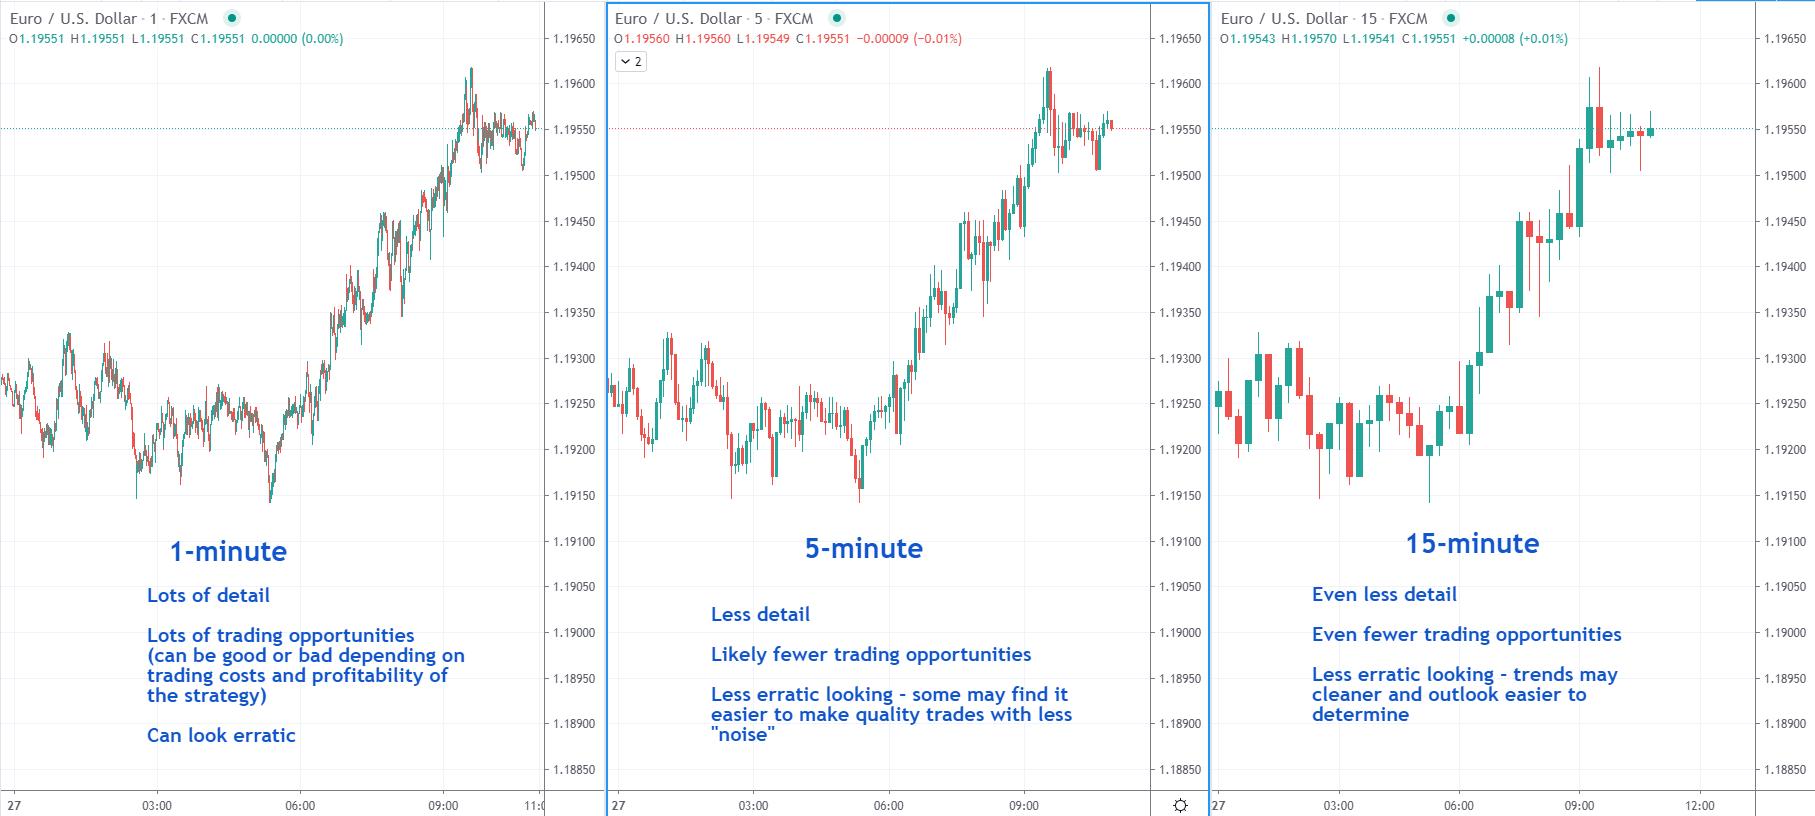
Intraday (1-hour, 15-min) works for scalps but prone to whipsaws. Use multi-timeframe: confirm daily pattern on 4-hour.
For example, a daily double bottom on AUD/USD gains strength from 4-hour volume spike.
Higher timeframes align with banks, per BIS reports on Forex turnover.
Practice switching views; patterns scale but distort lower.
What Are the Key Elements of a Valid Chart Pattern?
Key elements of a valid Forex chart pattern include clear support/resistance, symmetrical structure, volume confirmation on breakout, and alignment with trend, ensuring reduced false signals. Support/resistance forms the pattern’s backbone; price respects prior highs/lows.

Symmetry means proportional shoulders or equal touches. Head and shoulders needs balanced arms.
Volume drops during formation, surges on breakout. Low-volume breaks fail often.
Trend context matters: reversals after exhaustion, continuations mid-trend.
Add RSI divergence: bearish in tops, bullish in bottoms.
On USD/JPY triangles, measure convergence angle under 45 degrees for validity.
Backtest shows valid patterns hit targets 55-65% (Investopedia analysis).
Label patterns on TradingView; review weekly.
Master these, and patterns jump out. Apply in live markets cautiously.
(Total for this H2: 528)
How Do You Trade Chart Patterns Profitably in Forex?
Trade chart patterns profitably in Forex by entering on validated breakouts, placing stop-losses beyond pattern extremes, and targeting 1:2 risk-reward ratios, yielding consistent edges over time. Let’s see the basic mechanics in action.
Focus on high-probability pairs like majors.
What Are Entry and Exit Strategies for Reversal Patterns?
For reversal patterns, enter long/short on neckline breakout close with volume, stop-loss above/below pattern high/low, and take-profit at measured move projection. Head and shoulders: short below neckline, stop above right shoulder.
Example: EUR/USD double top at 1.1000, break at 1.0900, target 1.0700 (height subtracted).
Exit half at 1:1 RR, trail rest. Use 1% risk per trade.
Confirm with candlestick like engulfing.
Success rate climbs to 70% with filters (Forex Factory forums data).
Scale in on retests.
What Risk Management Rules Apply to Continuation Patterns?
Risk management for continuation patterns involves position sizing at 0.5-1% account risk, 1:3 RR minimum due to Forex volatility, and stops behind flag/triangle base. Flags: enter pullback to channel midline or breakout.
USD/CAD pennant: long above upper trendline, stop below pennant low.
Adjust for spreads; use ATR for stops (2x ATR common).
Trail stops to breakeven after 1:1.
In volatile pairs like GBP/JPY, halve size.
OANDA studies show RR >1:2 doubles expectancy.
Avoid news; trade post-event.
Practice on demos; journal trades.
(Total for this H2: 512)
Are Chart Patterns Reliable in the Forex Market?
Yes, chart patterns are reliable in Forex with success rates of 55-75% when confirmed by volume and context in trending markets, due to self-fulfilling trader adherence and liquidity. Specifically, reliability hinges on market conditions.
Trending environments boost performance; patterns fail in ranges. Majors like EUR/USD show cleaner signals.
Confirmation signals like volume or oscillators raise win rates. A TradingView backtest of 100 head and shoulders yielded 62% winners.
Market conditions matter: avoid low-liquidity Asia sessions.
False breakouts drop reliability to 40%; wait for closes.
Studies by Bulkowski rank head and shoulders at 83% reversal accuracy.
Combine with fundamentals: patterns near ECB levels excel.
Reliability improves with experience; pros filter 80% setups.
In Forex, 24-hour flow aids formation.
Test on historical data; adapt to pair volatility.
Patterns complement indicators, not standalone.
Rhetorical question: Ever backtested a flag on GBP/USD? Patterns hold up.
Overall, disciplined use makes them dependable tools.
What Common Mistakes Should You Avoid When Using Forex Chart Patterns?
Avoid common mistakes in Forex chart patterns by not entering prematurely without confirmation, ignoring fundamentals, forcing incomplete shapes, overtrading low-timeframe noise, and skipping risk rules. In detail, these pitfalls erode profits.
Premature entries before breakout lead to whipsaws. Wait for candle close beyond level.
Example: Jumping into a triangle mid-formation on USD/JPY costs pips.
Ignoring fundamentals blindsides patterns; Fed news invalidates tops.
Check economic calendars.
Forcing patterns on vague charts. Stick to textbook symmetry.
Overtrading intraday ignores timeframe reliability; daily patterns outperform.
Poor risk management like oversized positions wipes accounts in volatility.
Set 1% max risk.
Neglecting volume: flat volume breaks fail 70% (per pattern research).
Chasing after big moves misses consolidations.
Review journals weekly.
Rhetorical: Spot a double top yet trade against trend? Common error.
Emotional overrides: stick to plan.
Demo practice fixes habits.
Master avoidance for edge.
(Total for this H2: 518)
Advanced Insights and Related Questions on Forex Chart Patterns
Advanced insights elevate Forex chart pattern analysis by integrating harmonics, volume confirmation, market condition adaptations, indicator synergies, backtesting rigor, candlestick distinctions, and AI-driven predictions for superior trading edges.
Furthermore, these elements address common trader queries on specialized applications in volatile currency markets.
How Do Harmonic Chart Patterns Differ from Classic Patterns in Forex?
Harmonic chart patterns stand out in Forex trading because they incorporate precise Fibonacci ratios to pinpoint potential reversal zones, unlike classic patterns that depend mainly on visual price geometry. Classic patterns, such as head and shoulders or double tops, form through symmetrical structures signaling continuations or reversals based on support and resistance breaks. Harmonic patterns like the Gartley or Butterfly, however, require specific leg ratios, for example, XA leg retraced by 61.8% in AB=CD setups, offering tighter risk-reward entries amid Forex’s high volatility.
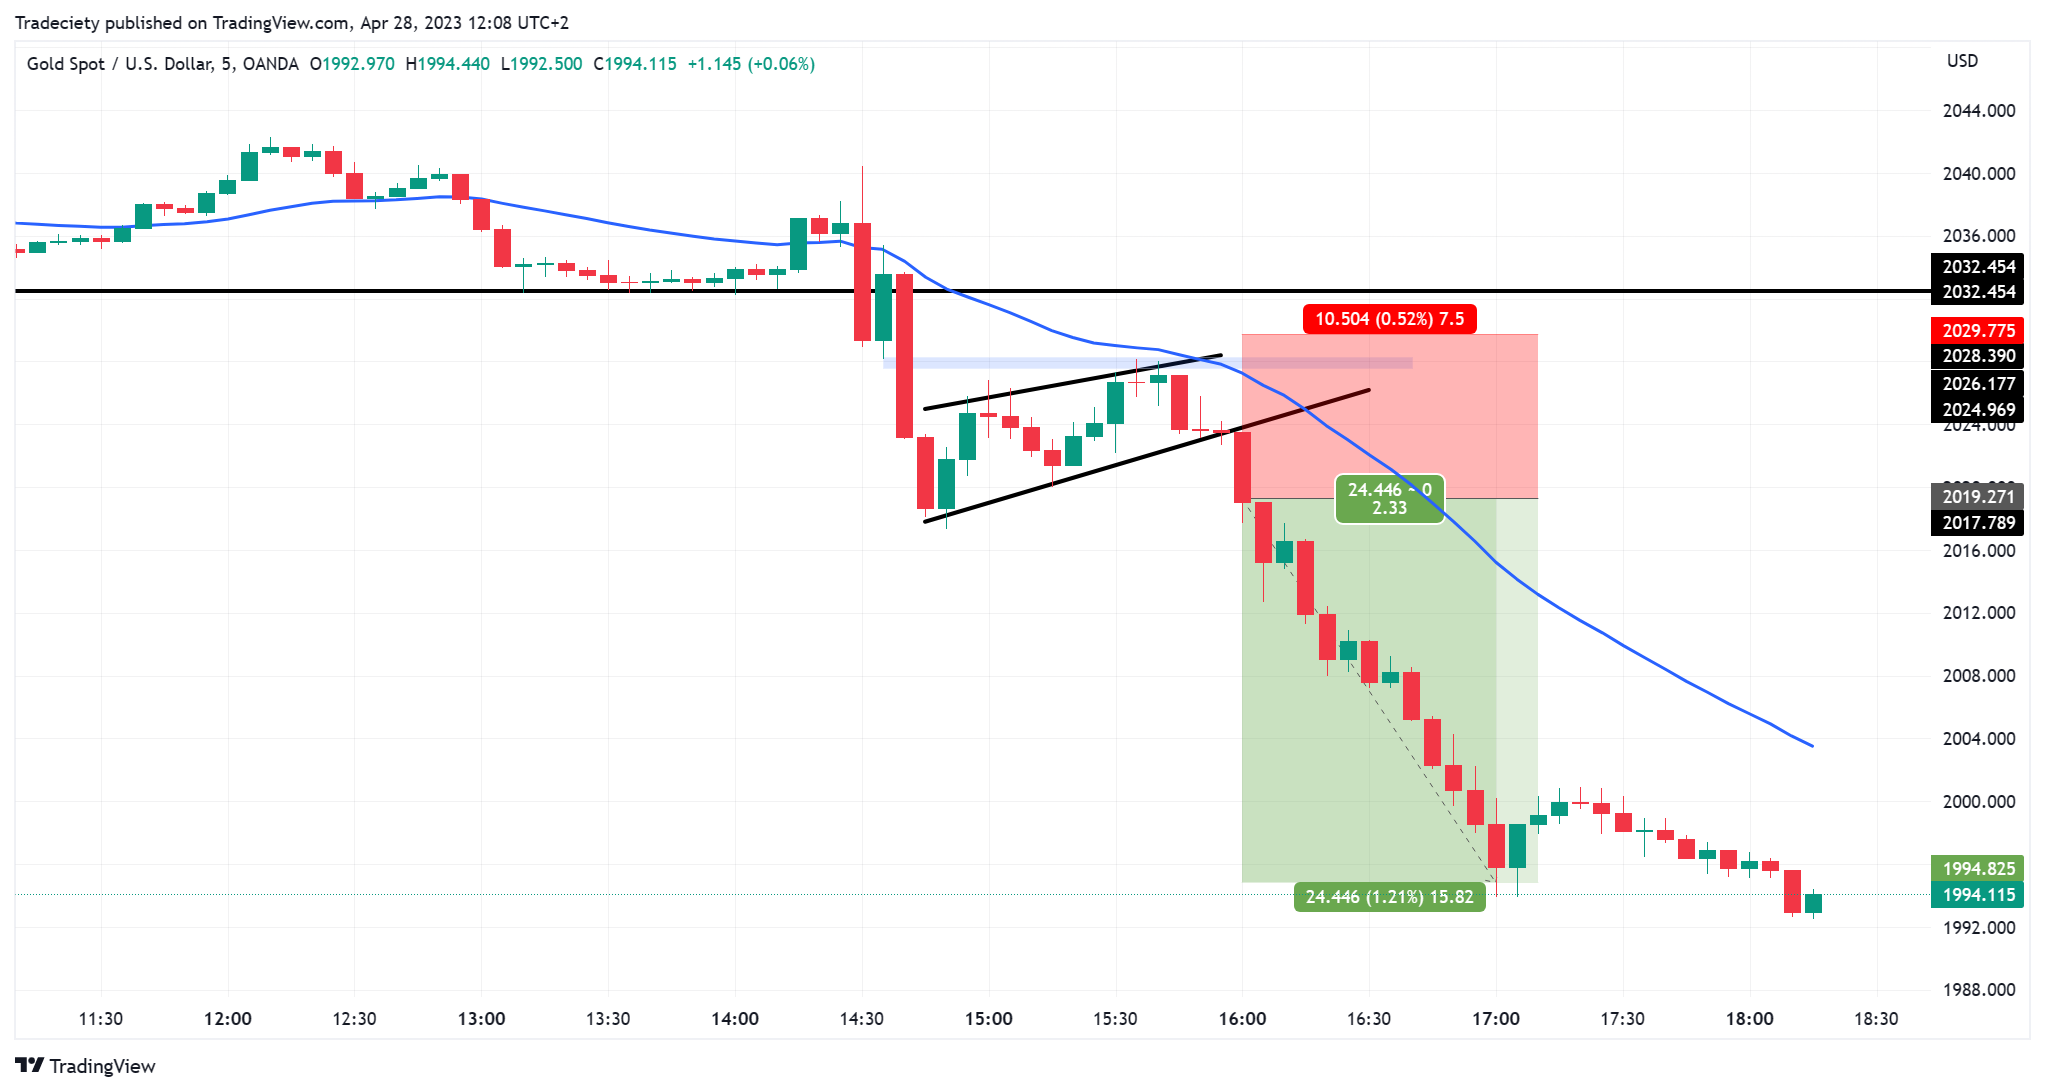
In practice, a Gartley bullish pattern completes with a 78.6% retracement on the final leg, providing a high-probability buy signal at the Potential Reversal Zone (PRZ). This precision suits pairs like GBPJPY, where news-driven swings demand exact timing. Classic patterns often fail in choppy sessions due to broader zones, but harmonics filter noise through math. Traders report higher win rates, around 70% per FXStreet analyses, when Fib tools confirm alignments.
You’ll notice harmonics demand patience for full formation, reducing false signals in 24-hour markets.
To grasp these distinctions further,
- Classic patterns emphasize shape and breakout volume, ignoring ratio specifics.
- Harmonics enforce Fibonacci confluence, like 1.27 or 1.618 extensions, for PRZ accuracy.
- In Forex, harmonics adapt to leverage-induced volatility, yielding 2:1 risk-reward ratios consistently.
What Is the Role of Volume in Confirming Forex Chart Patterns?
Volume plays a key confirmatory role in Forex chart patterns by validating breakouts and reversals, even in decentralized 24/5 markets where true exchange volume is absent. Instead, platforms like MetaTrader provide tick volume, measuring price change frequency as a proxy for activity. Rising tick volume during a triangle breakout on EURUSD signals genuine momentum, while fading volume suggests traps.
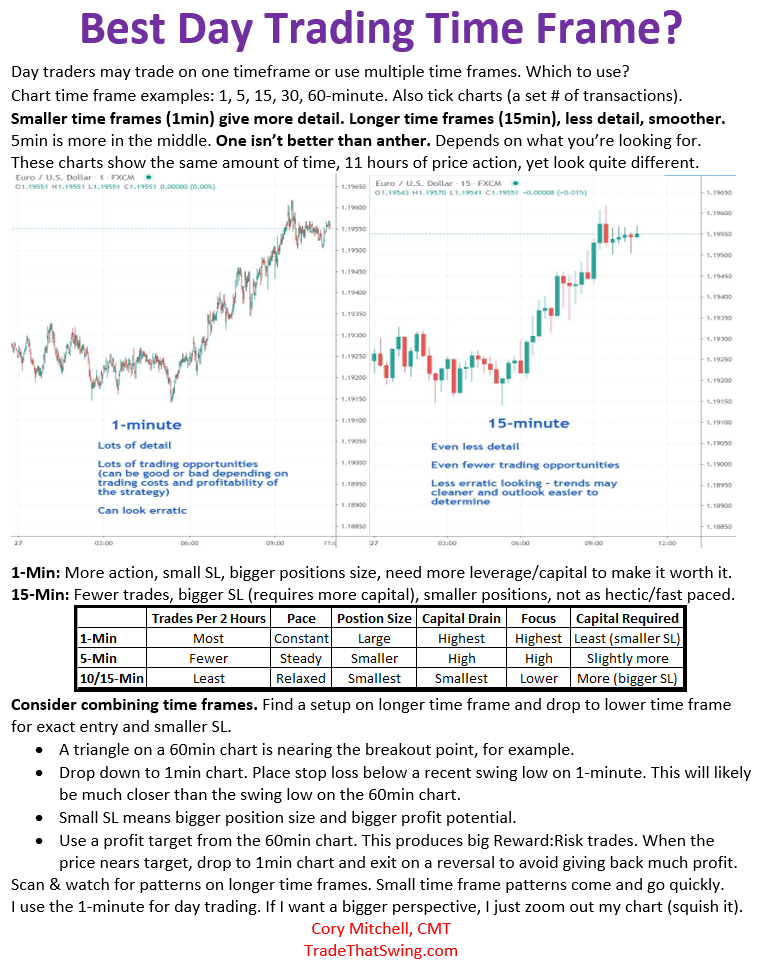
This metric shines in patterns like flags or wedges, where surging volume on the decisive candle confirms trend resumption. For instance, a head and shoulders neckline break with 1.5x average volume boosts reliability by 25%, per TradingView backtests. Low-volume breakouts often reverse, especially post-major news like NFP releases, highlighting volume’s filtering power.
Forex’s constant liquidity makes volume spikes rare but potent, often aligning with institutional flows visible on futures like CME Euro FX.
Besides that, consider how volume adapts to session overlaps.
- Asian sessions show subdued volume, ideal for range patterns like rectangles.
- London-New York overlap spikes volume, strengthening trend patterns like pennants.
- Divergences, such as price highs with volume drops, warn of pattern failures early.
How Do Chart Patterns Perform in Ranging vs. Trending Forex Markets?
Chart patterns perform differently across market conditions, with ranging markets favoring consolidation setups like symmetrical triangles or rectangles for breakout trades, while trending markets excel with continuation patterns like bull flags. In ranges, seen in AUDUSD during low-volatility periods, patterns resolve 60% of the time horizontally, per Myfxbook data, capturing 50-100 pips on breaks.
Trending environments, like USDJPY uptrends, see flags succeeding 75% with pullback entries, riding impulses. However, reversal patterns like double bottoms struggle in strong trends, failing 40% more often. Forex volatility, driven by carry trades, amplifies this: ADX above 25 confirms trends for pattern bias.
Have you wondered why patterns fail more in chop? Ranging efficacy drops without volatility filters.
What’s more, adapt strategies by market type.
- Use Bollinger Bands squeezes in ranges for triangle confluences.
- Trail stops with ATR in trends to maximize flag runs.
- Avoid reversals in trends below 20-period ADX readings.
What Are the Best Indicators to Combine with Forex Chart Patterns?
The best indicators to pair with Forex chart patterns are RSI, MACD, and moving averages, creating confluence for higher-probability setups. RSI (14-period) spots divergences, like hidden bullish ones in ascending triangles on NZDUSD, signaling continuations when RSI holds 40-60.
MACD histogram expansions confirm momentum on pennant breaks, while 50/200 EMA crossovers align patterns with trend bias. For example, a head and shoulders top near 200 EMA resistance with MACD bearish crossover yields 65% win rates, according to MT5 tester stats.
These tools filter Forex noise, especially on volatile crosses like EURGBP.
In particular, layer them sequentially.
- RSI overbought/oversold for reversal pattern entries.
- MACD zero-line crosses for breakout validation.
- EMAs as dynamic support in continuation setups like channels.
How Does Backtesting Improve Forex Chart Pattern Strategies?
Backtesting refines Forex chart pattern strategies by simulating historical performance on specific currency pairs, revealing win rates, drawdowns, and optimal parameters. Using MT4/5 Strategy Tester on 10 years of EURUSD data, traders quantify a double top’s 55% success with 1:2 risk-reward, adjusting stops to 1 ATR.
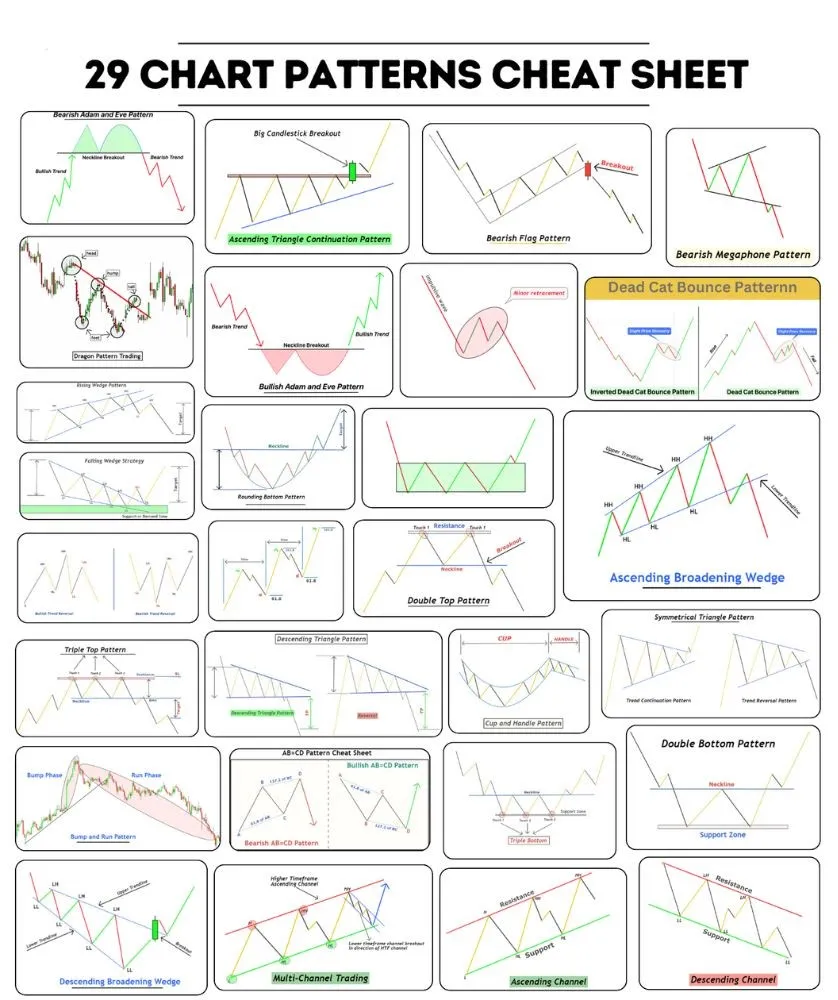
This process uncovers nuances, like flags outperforming in Tokyo sessions but failing post-FOMC. Manual or automated tests on 1H charts highlight slippage in high-spread pairs like GBPCHF, enabling rules like “only trade with 2:1 minimum.”
Platforms like Forex Tester Pro offer tick data for realism, boosting expectancy from 0.5 to 1.2 pips per trade.
Additionally, iterate with forward testing.
- Test 100+ instances per pattern for statistical validity.
- Vary timeframes, e.g., 4H patterns on majors vs. minors.
- Incorporate spreads and commissions for net profitability.
What Is the Difference Between Forex Chart Patterns and Candlestick Patterns?
Forex chart patterns differ from candlestick patterns in scale and prediction horizon, with chart patterns forming over 5-50 bars for multi-hour forecasts, versus candlesticks’ 1-3 bar signals for immediate reversals. A hammer candlestick hints at short-term bounces on USDCHF, but an engulfing pattern within a larger falling wedge forecasts sustained downtrends.
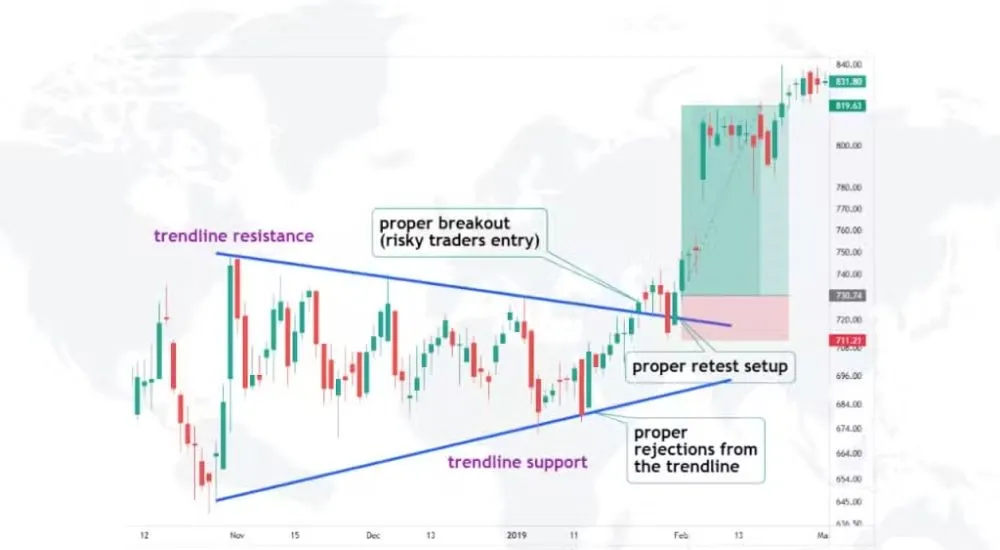
Structurally, chart patterns rely on connecting highs/lows (e.g., symmetrical triangles), while candlesticks focus on OHLC relationships like doji indecision. Predictively, patterns project targets via pole heights, candlesticks confirm via context.
In Forex, combine them: evening stars at head and shoulders shoulders enhance accuracy.
Moreover, distinguish applications clearly.
- Chart patterns suit swing trades on daily charts.
- Candlesticks excel for scalping intraday entries.
- Hybrids, like three white soldiers in channels, multiply edges.
Can AI Tools Predict Forex Chart Patterns More Accurately?
AI tools can predict Forex chart patterns more accurately than manual scanning by using algorithmic recognition on vast datasets, detecting subtleties like imperfect Gartleys in real-time. Platforms like TradingView’s Pine Script AI or Autochartist scan millions of bars, achieving 80% pattern hit rates versus 60% human averages, per broker audits.
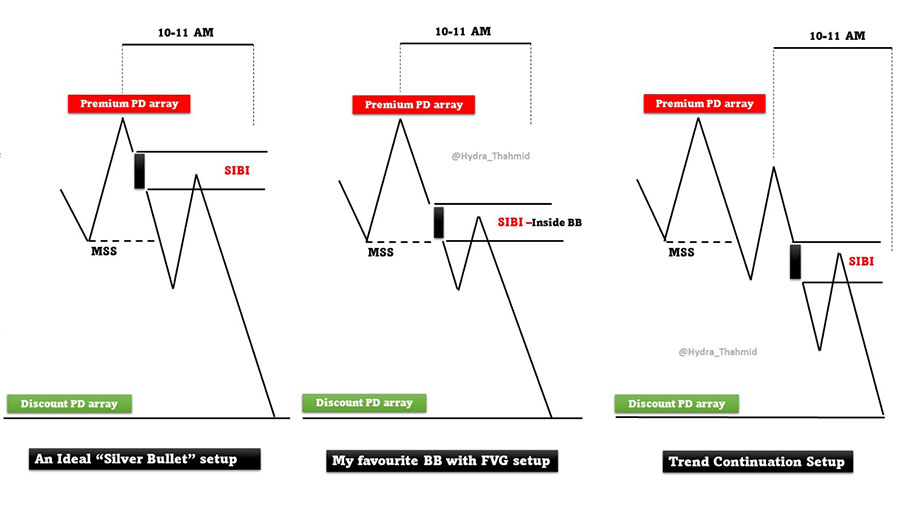
Machine learning models, trained on labeled EURUSD histories, forecast completions with neural networks, factoring volatility clusters. However, AI struggles with news black swans, requiring human overrides.
Retail tools like Pattern Recognition AI apps integrate seamlessly with MT5.
Especially useful for busy traders,
- Automate alerts on rare butterflies across 28 pairs.
- Backtest AI signals against pure price action.
- Blend with fundamentals for 15% edge gains.