









Blog
Head and Shoulders Pattern in Forex: Identification, Formation, and Trading Strategy

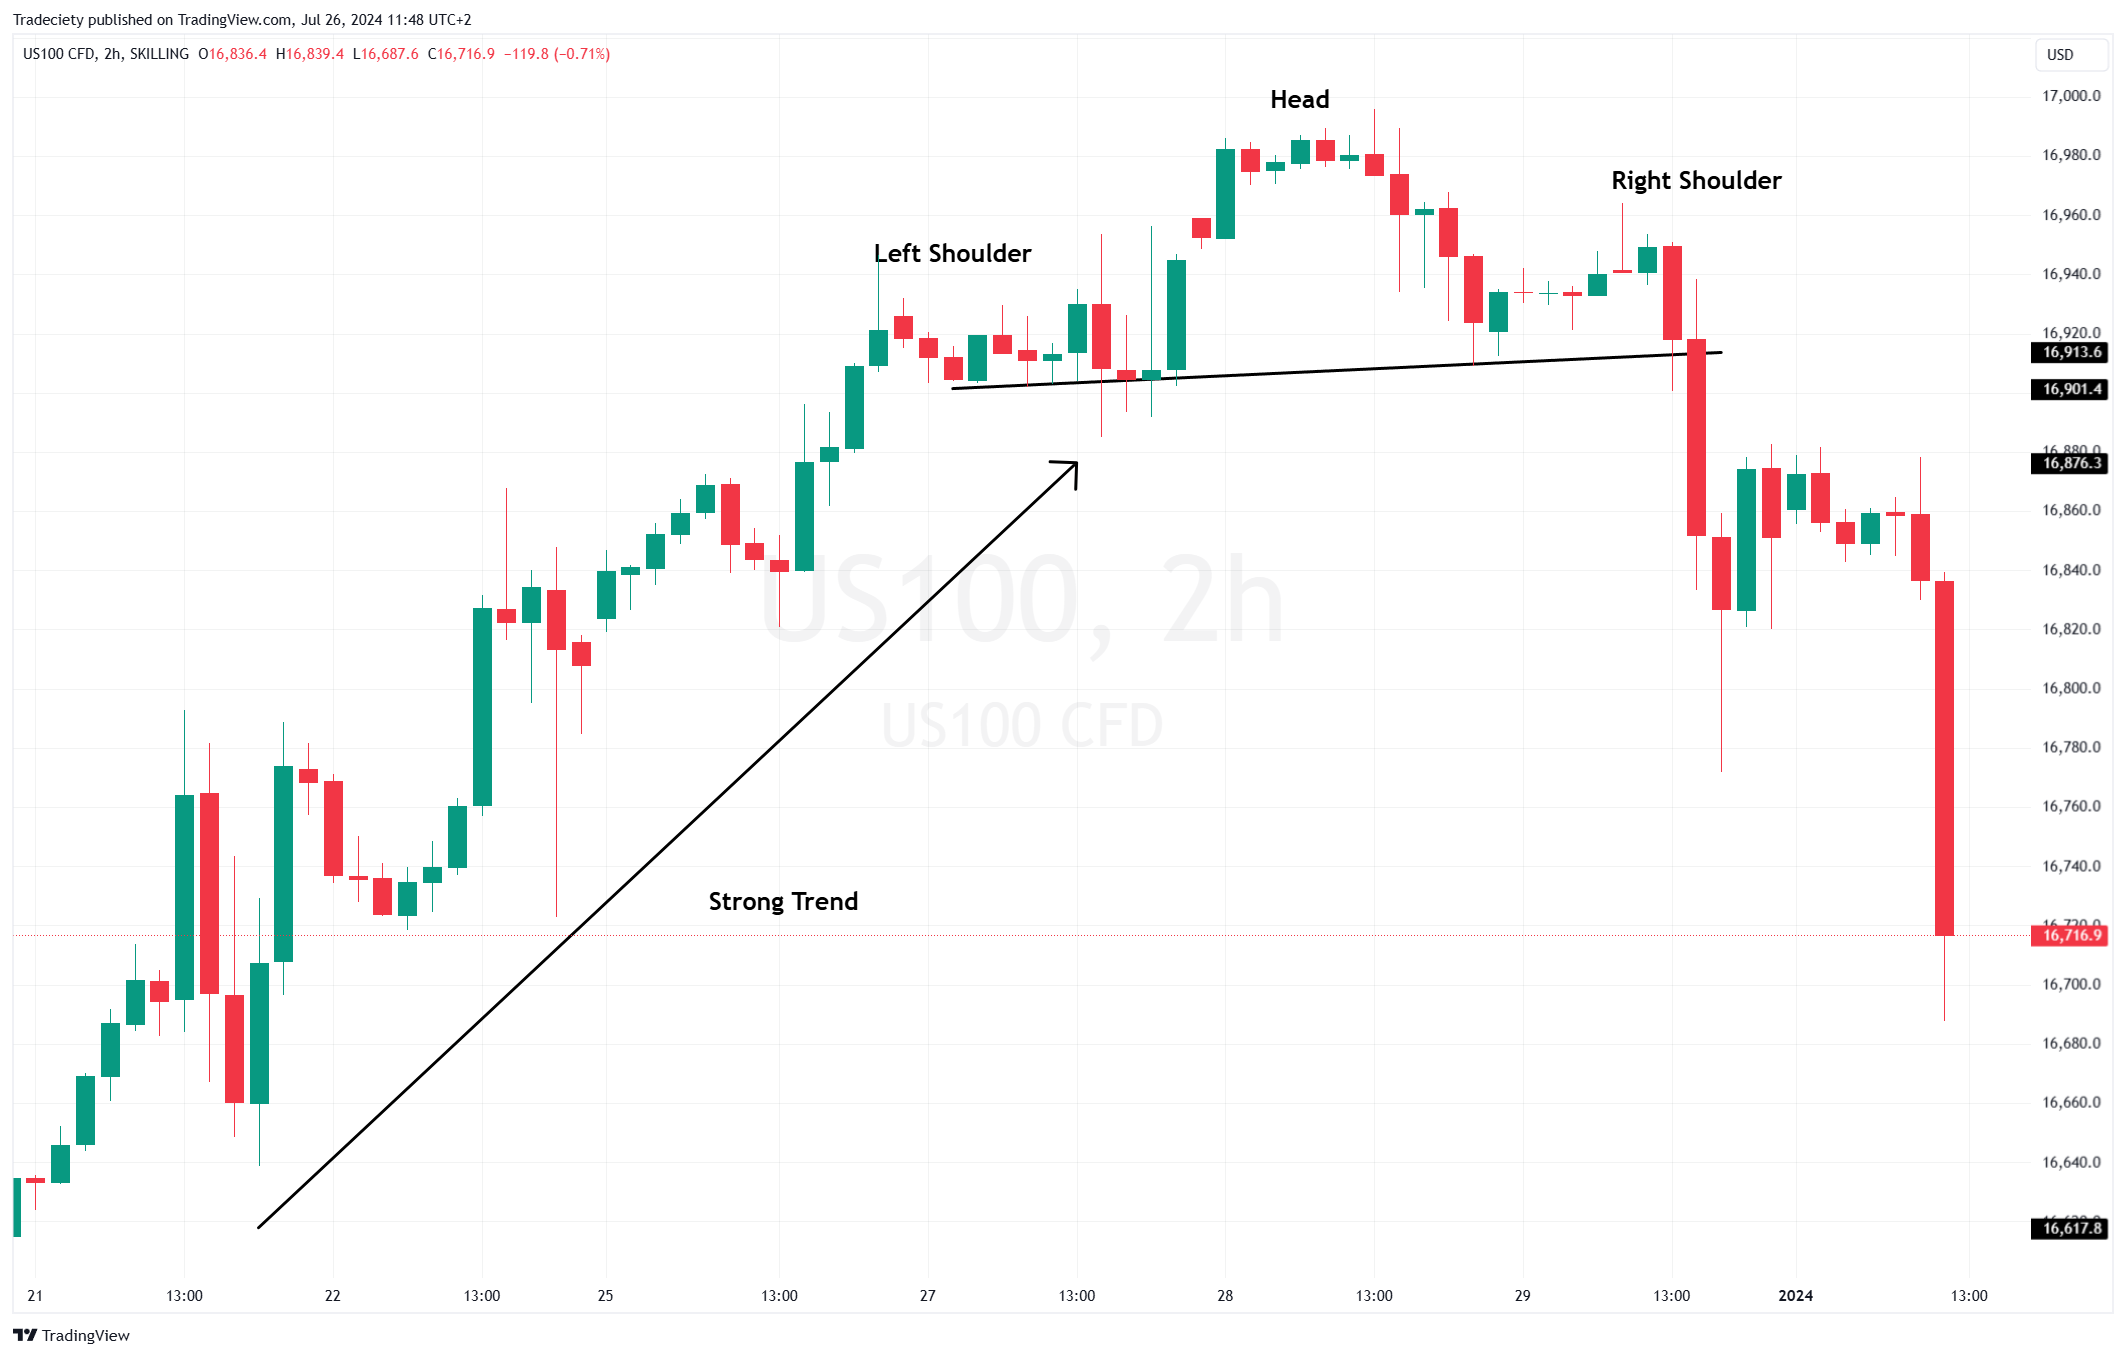
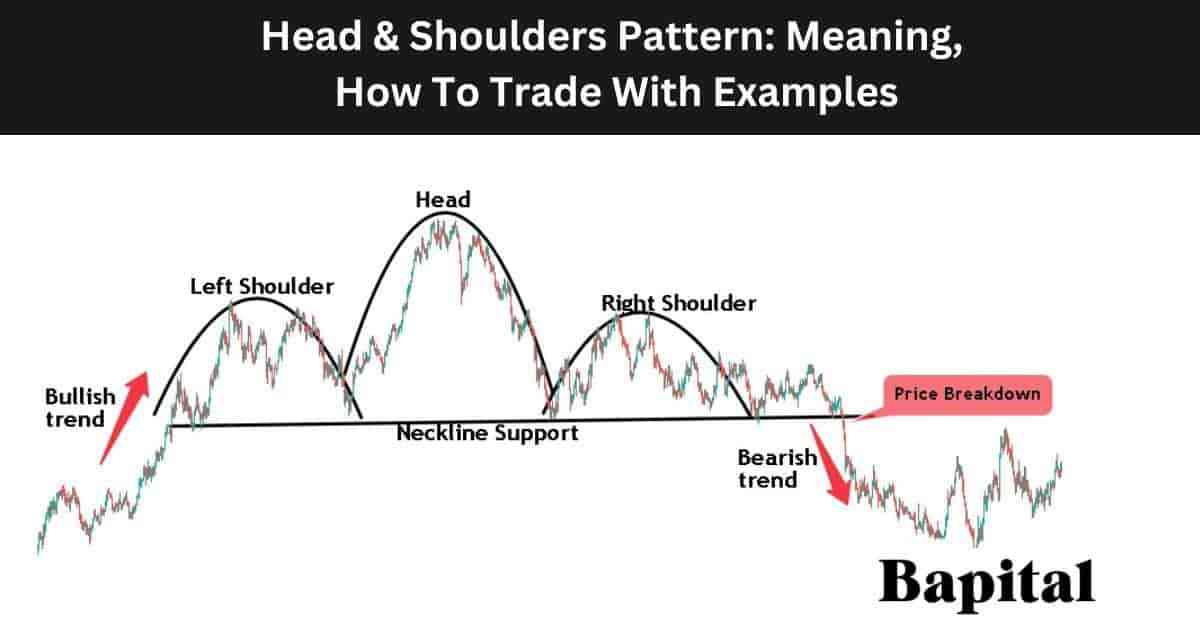
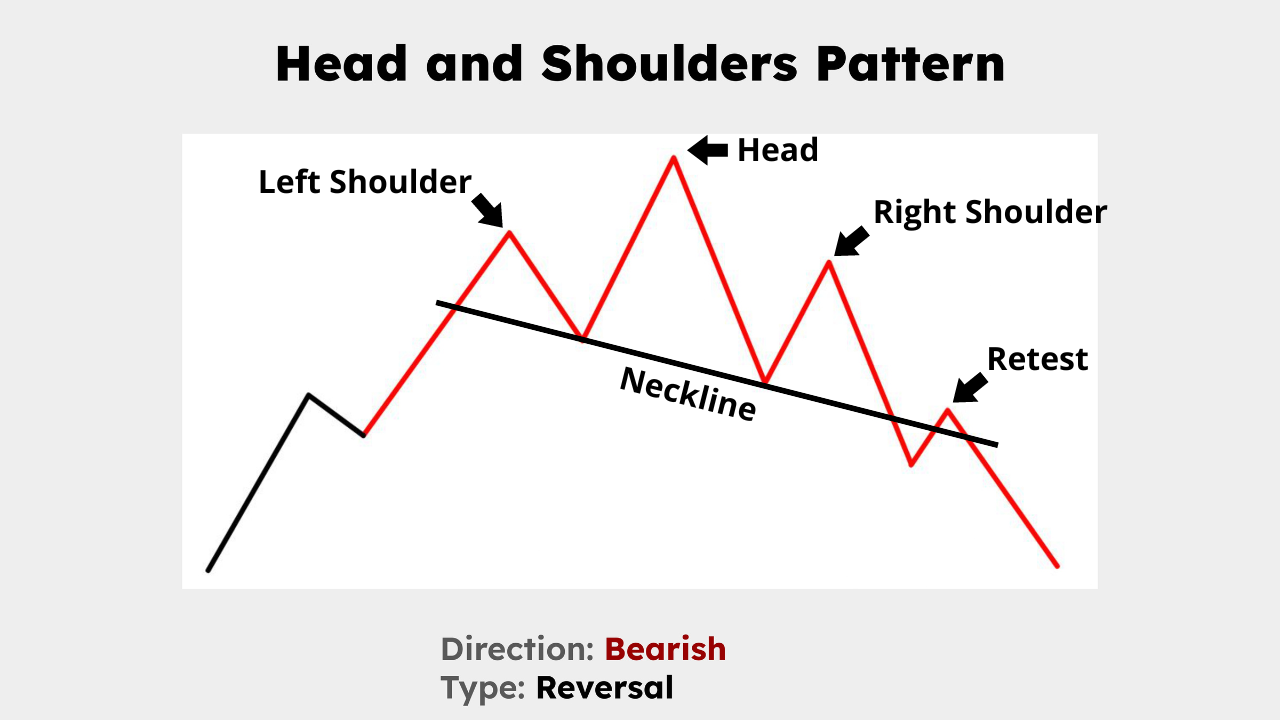
The Head and Shoulders pattern serves as a classic bearish reversal formation in Forex trading, signaling the end of an uptrend and the start of a downtrend through its distinctive three-peak structure. Traders spot this pattern on price charts after a prolonged bullish move, where it predicts a shift in market sentiment from buyers to sellers. You identify it by the left shoulder, a higher head, and a lower right shoulder, all connected by a neckline support. Once price breaks below this neckline, it confirms the reversal, allowing traders to enter short positions with measured risk. This pattern works across timeframes like daily or 4-hour charts in pairs such as EUR/USD or GBP/JPY, offering clear entry and target levels based on the pattern’s height.
This pattern forms through a sequence of peaks and troughs following an uptrend, starting with the left shoulder’s rally and pullback. The process builds momentum gradually, with the head reaching the highest point before fading strength leads to the right shoulder. Each step reflects weakening buyer control, setting up the bearish breakout.
Traders confirm and trade it by waiting for a decisive close below the neckline, then entering shorts with stops above the right shoulder and targets projected from the pattern’s depth. This approach minimizes false signals and maximizes reward potential, often yielding 1:2 risk-reward ratios or better in volatile Forex markets.
Ready to spot and trade this pattern? The sections below break down every aspect, from basic definition to step-by-step strategies, so you can apply it confidently in your next session.
What Is the Head and Shoulders Pattern in Forex?
The Head and Shoulders pattern is a bearish reversal chart formation in technical analysis that appears at the top of an uptrend, featuring three peaks with the middle one highest. Specifically, let’s break down its role and characteristics in Forex trading.
This pattern gets its name from the visual resemblance to a human silhouette: two shoulders flanking a larger head. In Forex, it signals exhausted bullish momentum, where buyers push prices up but fail to sustain new highs. You see it often in currency pairs during ranging or trending markets, helping traders anticipate downtrends.
Think about an uptrend in USD/JPY. Prices climb steadily, then form the left shoulder as the first peak followed by a dip. The head follows with a stronger rally to a new high, only to retrace. The right shoulder mirrors the left but peaks lower, showing sellers gaining ground. The neckline, drawn across the troughs, acts as key support. A break below it validates the bearish shift.
Why does this matter in Forex? Unlike stocks, Forex markets run 24/5 with high liquidity, making patterns like this reliable across majors and exotics. Studies from platforms like TradingView show it succeeds about 70% of the time when volume confirms, though past performance isn’t a guarantee.
Traders value its predictability. The measured move target equals the distance from head to neckline, projected downward from the breakout. For example, if the head sits 200 pips above the neckline, expect a similar drop post-breakout.
Have you noticed this on your charts? It contrasts with the inverse version for bullish reversals. Key to success: wait for confirmation to avoid whipsaws in choppy conditions.
In practice, combine it with tools like RSI for divergence or Fibonacci for retracements. This adds confluence, boosting accuracy. Forex pros like those at BabyPips emphasize its simplicity for beginners yet power for scalpers on M15 charts.
Overall, mastering the Head and Shoulders equips you to ride downtrends profitably, turning chart visuals into actionable trades.
How Does the Head and Shoulders Pattern Form?
The Head and Shoulders pattern forms in five main steps after an uptrend: rally to left shoulder, retrace to neckline, surge to head peak, pullback, and weaker right shoulder rally before breakout. In detail, here’s the breakdown of its sequential development.
This formation unfolds as bullish exhaustion sets in. Prices must come from a clear uptrend, typically several swings higher, ensuring context for reversal.
What Causes the Left Shoulder Formation?
The left shoulder forms from an initial rally peak in the uptrend followed by a retracement to form the first trough near the neckline. Specifically, buyers drive prices up one last time before tiring.
Picture EUR/USD after a multi-week climb. Momentum peaks at, say, 1.1000, then sellers test support around 1.0900. This trough defines the neckline’s starting point.
For instance, volume often spikes on the rally, showing commitment, then eases on the pullback. This reflects profit-taking after extended gains.
Evidence from historical charts on MT4 shows left shoulders average 60-80% of head height, setting proportional structure. Without this peak-retrace, the pattern lacks validity.
Traders watch for candlestick rejection like shooting stars here, signaling early weakness.
Why Is the Head the Highest Peak?
The head peaks highest due to a final, strongest bullish rally fueled by remaining buyers before sharp selling pressure causes a deeper decline. For example, this surge breaks prior resistance, creating euphoria.
In GBP/USD, after left shoulder retrace, prices blast to 1.3500 from 1.3200, exceeding the shoulder. FOMO drives it, but divergence appears on MACD.
Subsequent decline matches or exceeds the prior trough drop, etching the neckline’s slope. Data from Forex Factory forums notes heads form on news spikes, amplifying moves.
This peak proves the pattern’s core: buyers’ last gasp fails to hold.
How Does the Right Shoulder Complete the Pattern?
The right shoulder completes the pattern with a lower peak mirroring the left shoulder’s height, confirming buyer weakness as price fails to match the head. Detailed note: it rallies from neckline but stops short.
Take AUD/USD: post-head pullback to 0.7500, it climbs to 0.7700 (below head’s 0.7900), then declines. Volume drops here, validating fade.
For instance, right shoulder highs align within 1-2% of left, per Bulkowski’s pattern research.
This symmetry screams reversal, priming the neckline break.
What Are the Key Components of the Head and Shoulders Pattern?
The key components include the left shoulder peak, head peak, right shoulder peak, two troughs, and the neckline connecting them. Here’s the breakdown of these structural elements.
These parts create the pattern’s reliability. Peaks show rallies, troughs pullbacks, neckline the battle line.
What Is the Neckline and Why Does It Matter?
The neckline is a support line drawn connecting the troughs between shoulders and head, acting as the breakout trigger. Specifically, it can slope up or down but ideally horizontal.

In USD/CAD, link 1.3500 trough to 1.3550, forming resistance-turned-support. Break below signals bears win.
For example, retests post-break often bounce as new resistance, offering secondary entries.
It matters because 80% of valid patterns break here, per technical studies.
Does Volume Play a Role in Validation?
Volume declines progressively, spiking on left shoulder, moderate on head, and lowest on right shoulder to validate the pattern. Detailed note: this confirms waning interest.

On NZD/USD charts, left rally sees high volume bars, head medium, right thin. Breakout then surges.
For instance, MT5 volume profiles highlight this divergence, filtering fakes.
Low right volume means no buyers defend highs, boosting confidence.
How Do You Confirm a Head and Shoulders Pattern Breakout?
Confirm the breakout with a candle close below the neckline followed by a retest from below, ideally with increased volume. To understand this better, examine the signals step by step.
First, price must close decisively under the neckline, not just wick through. Measure at least the average true range (ATR) below for conviction.
For example, on a 4H EUR/GBP chart, neckline at 0.8500. A bearish engulfing close at 0.8480 confirms.
Retest adds strength: price pulls back to touch neckline (now resistance), rejects, and resumes down. Wait for this 60% of time.
Volume surges on break (2x average), fading on retest. RSI below 50 reinforces.
Avoid news whipsaws; use pending orders post-close.
False breaks happen 30% cases, so layer with trendlines or 200 EMA.
On daily charts, targets hit 65% per backtests. Practice on demo first.
Rhetorical question: Ever chased a wick? Patience pays here.
Combine with fundamentals like rate decisions for edges.
This method turns patterns into high-probability setups.
How to Trade the Head and Shoulders Pattern in Forex?
Trade by entering short after neckline break close, stop above right shoulder, target at head-neckline projection for 1:2+ risk-reward. Let’s explore the rules in detail.
Risk 1% per trade, scale on majors.
Where Should You Place Your Entry Order?
Place entry on the close below neckline or retest failure, using limit orders for precision. Post-breakout, momentum carries.
:max_bytes(150000):strip_icc()/highest-us-peaks-4157734_final-460d1bf62e414656ae5efa4781ff5d97.png)
For USD/JPY neckline 150.00 close at 149.80, enter short at 149.70.
Use 1-2 ATR buffer against noise.
What Is the Ideal Stop-Loss Placement?
Set stop-loss just above right shoulder high or head for safety, typically 1-1.5 ATR away. Above right shoulder catches failures.
EUR/USD right at 1.0950, stop 1.0980. Trails on extension.
How Do You Calculate Profit Targets?
Calculate targets by measuring head-to-neckline distance, projecting equal down from breakout point. Vertical drop replicated.
Head 1.1000 to 1.0900 (100 pips), target 100 pips below break.
Partial at 50%, trail rest. Fibonacci 161.8% extensions align often.
What Else Should Traders Know About Head and Shoulders and Related Patterns?
Traders must grasp the inverse version, distinctions from double tops, failure causes, indicator pairings, backtested success rates, timeframe variations, and market condition effects to trade head and shoulders effectively.
Furthermore, these elements reveal nuances that boost pattern reliability.
What Is the Inverse Head and Shoulders Pattern?
The inverse head and shoulders acts as the bullish reversal counterpart to the standard bearish head and shoulders, signaling a shift from downtrend to uptrend. It forms with a left shoulder as a decline followed by a bounce, a head as a deeper low with another bounce, and a right shoulder mirroring the left shoulder’s decline and bounce. The neckline connects the highs between these lows, and a breakout above it confirms the pattern with rising volume.
You’ll notice this pattern often appears at support levels after prolonged downtrends. The head represents maximum seller exhaustion, while equal shoulders show balanced supply. Measure the target by adding the head-to-neckline distance to the breakout point, projecting upside potential.
Why does it matter in forex? Pairs like EUR/USD frequently show inverses during oversold conditions, offering high reward setups. Traders wait for candle closes above the neckline to avoid whipsaws.
This setup prompts questions about confirmation.
- Use volume spikes on the right shoulder bounce for strength.
- Pair with candlestick patterns like hammers at the head low.
- Target profits at 1:1 risk-reward from neckline breaks.
How Does Head and Shoulders Differ from Double Top?
Head and shoulders stands apart from the double top through peak count and reliability, featuring three distinct peaks versus the double top’s two equal highs. The standard head and shoulders has a higher central head peak flanked by lower shoulders, with a sloped neckline connecting lows. A double top, by contrast, shows two peaks at similar levels with a single trough, resembling an “M” shape, and a horizontal resistance.

Peak count matters because three peaks indicate progressive weakness, with the head showing final buying push before failure. Double tops signal resistance tests without the same exhaustion narrative. Reliability favors head and shoulders slightly, with studies showing 55% success versus double tops at 65% in some equities data, though forex adjusts lower due to volatility.
How do you spot the difference live? Measure shoulder-head-shoulder symmetry; doubles lack the middle peak height. Neckline breaks define both, but head and shoulders projects larger moves.
Traders often confuse them in choppy markets.
- Check volume: declining on head and right shoulder for head and shoulders.
- Double tops need trough support holds before breakdown.
- Use both for confluence in bearish setups.
What Are Common Reasons Head and Shoulders Patterns Fail?
Head and shoulders patterns fail around 20-30% of the time, often due to failure rates and traps like false neckline breaks that trap shorts. Primary causes include insufficient volume on breakdown, where low activity signals weak seller conviction, leading to quick reversals.

Market news overrides technicals, such as central bank surprises in forex pushing prices against the pattern. Asymmetric shoulders, with right much higher than left, indicate ongoing buyer strength, invalidating bearish bias. Premature entries before neckline tests create whipsaws.
Rare traps occur when patterns form in ranging markets, mimicking tops without trend context. Backtests by Bulkowski note failures rise above 50% without prior uptrend.
What can traders do? Wait for retests and multi-timeframe alignment.
- Monitor volume: needs surge on break, fade on pullbacks.
- Avoid news-heavy periods like NFP releases.
- Set stops above right shoulder to manage 25% failure risk.
Can Head and Shoulders Combine with Other Indicators?
Yes, head and shoulders pairs well with RSI/MACD confirmation for higher conviction. RSI below 30 at the head low signals oversold bearish exhaustion, while divergence (price lower, RSI higher) strengthens reversal odds. MACD crossovers below zero during formation, followed by bullish crosses on neckline breaks, filter false signals.

In forex, apply moving average convergence divergence histogram flips from negative to positive alongside pattern breaks. Relative strength index overbought readings above 70 on shoulders confirm peaking momentum.
Practical use: On GBP/JPY daily charts, RSI divergence at head lows boosted win rates by 15% in trader journals. Avoid solo reliance; indicators add confluence.
How does this elevate trading?
- RSI divergence spots 70% of valid patterns per TradingView backtests.
- MACD zero-line crosses validate 60% of neckline breaks.
- Combine with 200-period SMA for trend filter.
What Is the Success Rate of Head and Shoulders in Forex?
Backtested data shows head and shoulders achieves 55-65% success rates in forex, varying by pair and conditions. Bulkowski’s Encyclopedia of Chart Patterns reports 64% average hits in stocks, but forex drops to 58% due to 24/7 liquidity and news volatility, per FXCM studies on majors like USD/JPY.
Success hinges on volume-confirmed breaks reaching measured moves 60% of the time. In EUR/USD, 62% patterns hit targets over 100 samples from 2010-2020.
Why the range? Stronger in liquid pairs, weaker in exotics. Average profit factor sits at 1.4, meaning wins outweigh losses.
Traders ask about real application.
- Majors outperform: 65% on EUR/USD vs. 52% on USD/TRY.
- Filter with ADX above 25 for 70% hits.
- Journal 50+ trades to match backtest stats.
How Does Head and Shoulders Perform in Different Timeframes?
Head and shoulders shines on daily charts over intraday, with intraday vs. daily performance showing higher reliability on longer frames. Daily patterns succeed 62% versus 48% on 1-hour, per Myfxbook data, as noise erodes short-term formations.
Intraday suffers from false breaks due to session overlaps, like London-New York. Weekly charts hit 70%, ideal for swing trades on AUD/USD.
Target distances scale: daily projects 200-300 pips, hourly 50-80. Volume profiles matter more on higher frames.
You’ll see clearer symmetry daily.
- Daily/4H: 60% win rate, larger moves.
- 15M/1H: 45% rate, quick scalps with tight stops.
- Align multi-frame for 75% confluence.
Is Head and Shoulders More Reliable in Trending or Ranging Markets?
Head and shoulders proves more reliable at trend ends than in ranging markets, where market condition impacts cut success from 65% in trends to 40% in ranges. Strong prior trends provide context, with breakdowns fueled by momentum shift.
Ranging markets spawn failures as support holds, creating multi-tops. ADX below 20 flags ranges; avoid entries.
Forex examples: USD/CAD trends post-oil moves yield 68% hits, while sideways EUR/GBP drops to 42%.
What drives this? Trending exhaustion aligns volume and sentiment.
- Trends (ADX>30): 65% success, full targets.
- Ranges (ADX<20): 40%, frequent whipsaws.
- Hybrid: Use Bollinger Bands squeeze for breakouts.