









Blog
Maximum Drawdown in Forex Trading: Definition, Calculation, and Risk Management


Maximum Drawdown measures the biggest drop in your Forex trading account from its highest point to its lowest, shown as a percentage, helping traders gauge risk and protect capital through careful strategy evaluation. This metric tracks the worst historical loss period, which is key in Forex where leverage amplifies moves. You calculate it by taking the peak equity value, subtracting the trough value right after, and dividing by the peak, then multiplying by 100 for a percentage. Traders use this to set stop-loss rules and avoid blowing accounts during volatile currency swings.
The formula for Maximum Drawdown is MDD = (Peak Value – Trough Value) / Peak Value × 100, applied to your equity curve over time. This gives a clear picture of potential pain from a strategy. For instance, if your account hits $10,000 and falls to $7,500 before recovering, that’s a 25% drawdown. Platforms like MetaTrader automatically plot these on charts, letting you spot patterns in EUR/USD or GBP/JPY trades.
Maximum Drawdown guides risk management by setting limits, such as capping it at 10-15% per strategy, to preserve capital in Forex markets. It influences position sizing, where you risk only 1-2% per trade to keep overall drawdowns low. This approach prevents emotional decisions during losing streaks.
Now that you see its core value, let’s break down each aspect in more detail, starting with a clear definition.
What is Maximum Drawdown?
Maximum Drawdown is the largest peak-to-trough decline in account equity during a trading period, capturing the worst loss from high to low in Forex accounts. Specifically, this metric highlights how much your balance dips before recovering, rooted in measuring peak-to-trough changes.
Here’s the breakdown of what this means for your trades. Imagine your Forex account grows steadily from deposits and winning pips on USD/JPY pairs. It reaches a peak, say after a series of profitable scalps. Then comes a rough patch with news events tanking your positions. The drawdown is that gap from peak to the lowest point before it climbs back.
Why focus on peak-to-trough? It shows real-world pain, not just daily losses. A 30% drawdown means you’d need a 43% gain just to break even, which pressures psychology in leveraged Forex. Traders review historical charts to find the absolute max over months or years.
How Does Maximum Drawdown Measure Trading Risk?
Maximum Drawdown quantifies trading risk by showing the largest historical loss from a peak, revealing worst-case scenarios in Forex volatility. It goes beyond average losses to spotlight the deepest equity drop, often during correlated currency crashes.
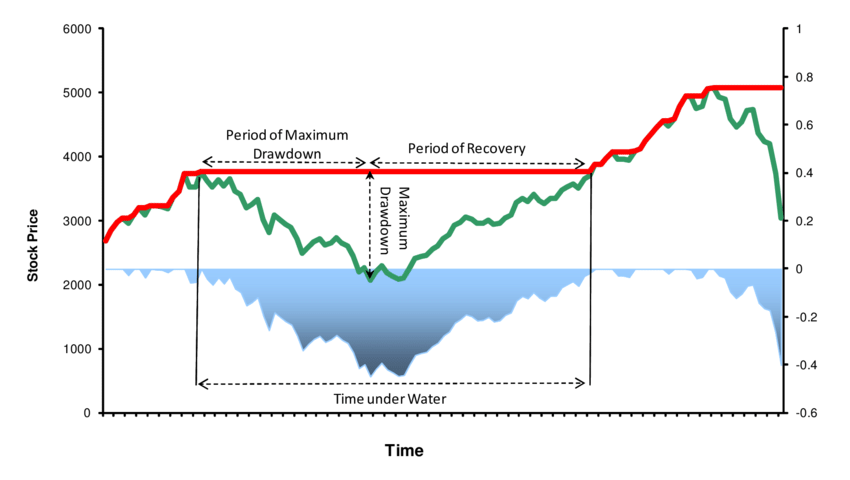
For example, during the 2015 Swiss franc shock, many accounts saw 50%+ drawdowns. This metric flags if a strategy survives black swans. Specifically, low drawdown strategies use tight stops on pairs like AUD/USD.
You’ll notice it pairs with volatility. High Forex pairs like GBP/USD swing more, pushing drawdowns up. Evidence from backtests on TradingView shows strategies with under 15% MDD lasting longer.
In practice, brokers like IC Markets display running MDD. Traders set alerts at 10% to pause trading. This keeps risk in check, preserving months of gains.
Main point: It stresses capital protection. A study by FXCM found traders with MDD over 25% quit faster. Use it to benchmark against peers.
Another angle: It reveals strategy flaws. If drawdowns cluster during Asian sessions, adjust time filters.
Overall, this measure turns vague fear into numbers, guiding safer Forex journeys.
How is Maximum Drawdown Calculated in Forex?
Calculate Maximum Drawdown with this 3-step formula: MDD = (Peak Value – Trough Value) / Peak Value × 100, identifying the largest percentage drop in equity. In detail, scan your equity curve for every peak, find the lowest trough after it, compute each drop, and pick the maximum.
To understand this better, start with your trading platform’s equity chart. It includes closed profits, open floating P&L, and deposits. Numbered steps make it simple:
1. Identify peaks: Mark every local high in equity, like after a big NFP win on EUR/USD.
2. Find troughs: From each peak, note the lowest point before a new high exceeds it. Ignore recoveries until then.
3. Compute percentage: Plug into the formula. For a $20,000 peak dropping to $16,000, MDD = ($20,000 – $16,000) / $20,000 × 100 = 20%.
Tools like Myfxbook automate this, scanning MT4 exports. Manual checks suit custom EAs.
What is Absolute Maximum Drawdown vs. Relative Maximum Drawdown?
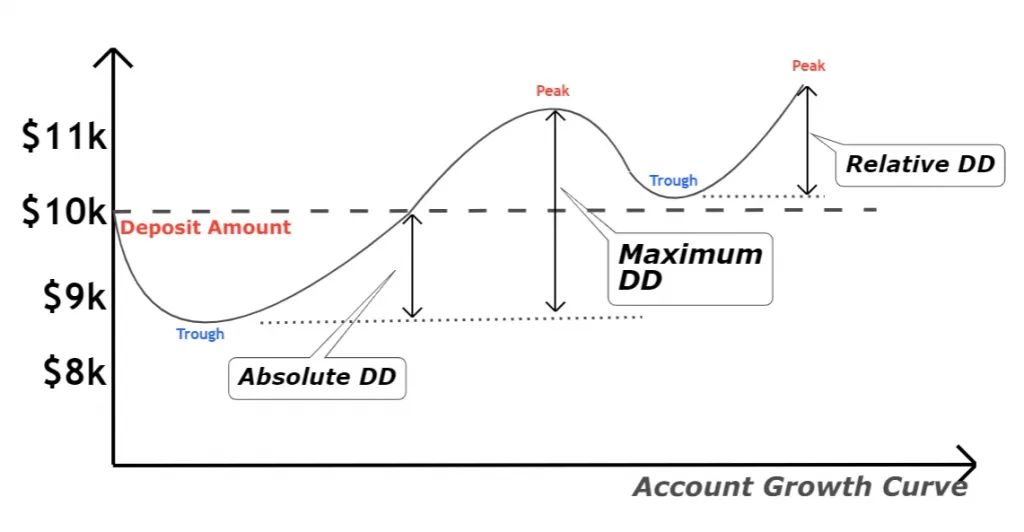
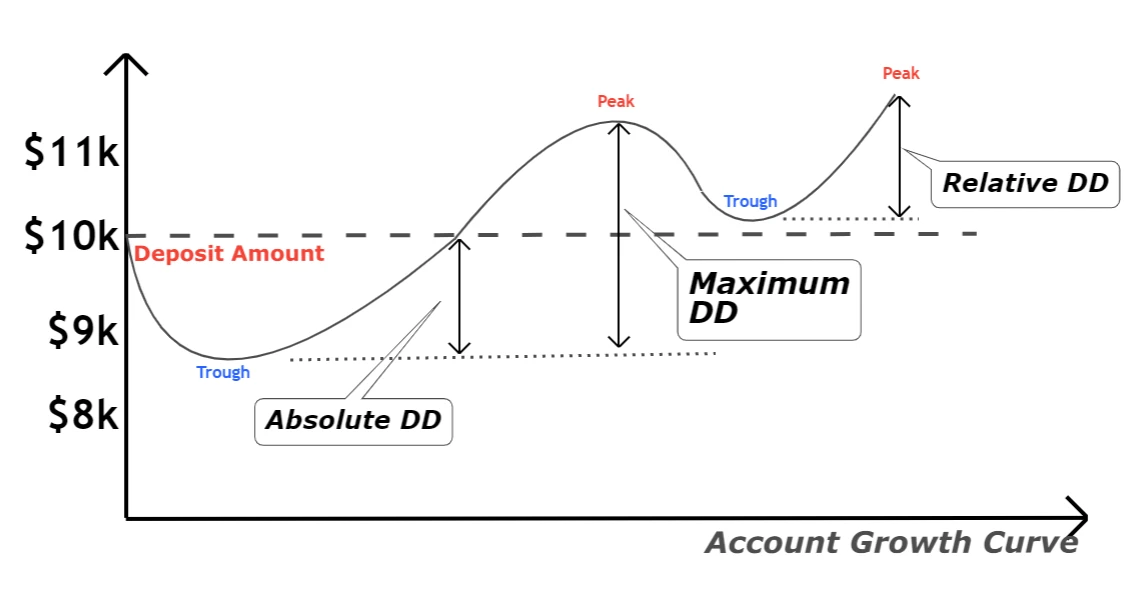
Absolute Maximum Drawdown uses fixed currency amounts, while relative uses percentages of peak value, suiting different account scales in Forex. Absolute might be $5,000 loss from $50,000 peak, relative 10%.

Specifically, absolute fits fixed-lot traders. A $10,000 drop hurts a $50,000 account less than a $100,000 one. Relative standardizes for comparison, ideal for prop firms.
For instance, a scalper risks $200 absolute per day, but relative shows 2% overall. Evidence from Dukascopy reports: Relative MDD under 12% flags sustainable EAs.
Pros of relative: Scales with growth. A growing account tolerates bigger absolute drops percentage-wise.
Absolute shines for bankruptcy risk. If it nears deposit size, stop.
Traders mix both. Brokers like Pepperstone report relative primarily.
Is Maximum Drawdown Calculated on Equity or Balance?
Maximum Drawdown uses the equity curve, which includes open positions’ floating profits/losses, not just closed balance in Forex. Equity reflects real-time value, capturing unrealized risks.

Balance ignores open trades, understating drawdowns. Say balance is $10,000, but open EUR/GBP loses $2,000: equity is $8,000, showing 20% MDD if peak was $10,000.
For example, during Brexit volatility, equity plunged 30% intraday before closes. Platforms plot equity for accuracy.
Specifically, MT5 equity includes swaps, margins. Backtests confirm: Balance MDD misses 40% of risks per QuantConnect data.
Why equity? Forex leverage means open P&L dominates. A 1:500 levered position swings equity wildly.
Traders watch both. Balance for withdrawals, equity for MDD limits.
Why is Maximum Drawdown Important for Forex Traders?
Maximum Drawdown matters because it tests strategy viability and protects capital by revealing potential wipeouts in Forex trading. Let’s explore how it shapes decisions from newbies to pros.
First, it sorts winners from gamblers. A strategy with 50% MDD might win big but risks account death. Conservative traders cap at 15%, trading fewer lots on USD/CAD.
You’ll ask: Does it predict blowups? Not exactly, but patterns warn. Clustered drawdowns signal over-optimization.
In live trading, it drives rules. Prop firms like FTMO reject over 10% MDD in challenges. This preserves firms’ money.
Psychologically, it fights revenge trading. Seeing 25% MDD tempts doubling down, but limits enforce discipline.
Data from Myfxbook: Top 10% performers average 12% MDD, versus 35% for average traders.
It benchmarks growth. Post-drawdown recovery time matters. A 20% MDD takes 25% gains to fix, slowing compounding.
For EAs, backtest MDD under live conditions. High MDD fails forward tests.
Overall, ignoring it leads to margin calls. Track via journals or Excel.
What Role Does Maximum Drawdown Play in Risk Management?
Maximum Drawdown shapes risk management by setting drawdown limits for position sizing, leverage, and trade halts in Forex. It acts as a guardrail, preventing small losses from snowballing.
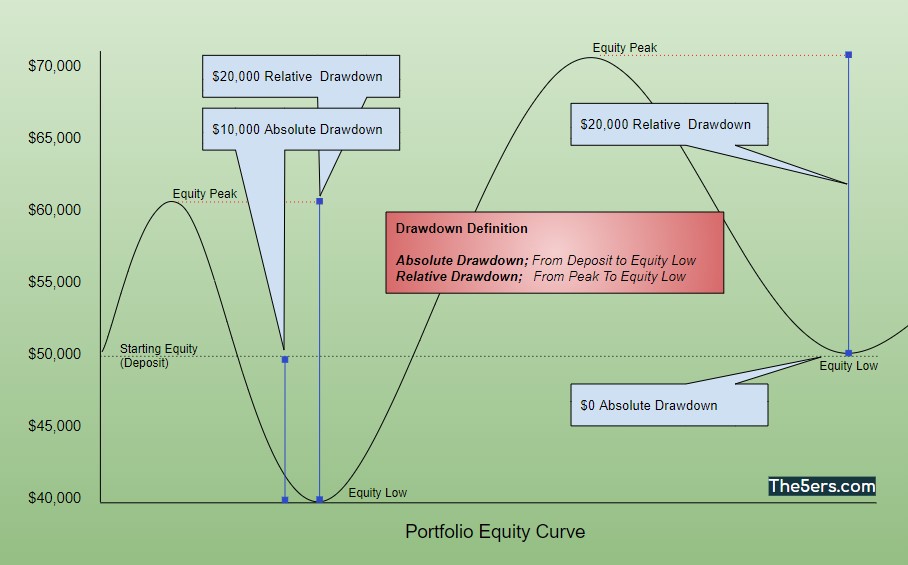
Specifically, use 1% risk per trade to cap MDD at 20%. Kelly criterion adjusts sizes: Position size = (Win% – Loss%) / Odds × MDD tolerance.
For example, on GBP/USD, 50-pip stop at 0.01 lots risks $5 on $5,000 account. Scale up safely.
Leverage ties in: 1:100 keeps MDD low versus 1:500 blowups.
Evidence from BabyPips forums: Traders enforcing 10% MDD limits survive 5x longer.
Instance: Weekly reviews. Hit 8%? Halve sizes.
It integrates with VaR. MDD over 15% triggers strategy pause.
Tools like Riskalyze simulate MDD scenarios.
What is a Good Maximum Drawdown Level in Forex?
A good Maximum Drawdown level in Forex stays under 20% for conservative strategies, with 10-15% ideal for most sustainable approaches. To understand this better, benchmarks depend on returns and style, but lower always aids longevity.
Aim for MDD below expected annual return divided by 2. A 30% yearly goal tolerates 15% MDD.
Retail traders average 25-40% MDD per broker stats, but pros hit under 10%.
Rhetorical question: Would you risk half your account for 50% gains? Low MDD builds trust.
Track relative MDD monthly. Over 5%? Audit trades.
How Does Maximum Drawdown Vary by Trading Style?
Maximum Drawdown varies by style: scalping keeps it low at 5-10%, swing at 15-25%, position trading higher at 20-40%. Grouped by hold time and exposure.
Scalping: Quick in/out on M1 charts like EUR/USD. Tight stops yield low MDD. Example: 1% daily risk caps it.
Swing: Holds days, exposed to news. GBP/JPY swings push 20% MDD. Use trailing stops.
Position: Weeks/months, trends like USD index. Higher MDD from gaps, but big wins.
Data from Forex Factory: Scalpers average 8%, swing 18%.
Adjust: Scalpers max 2% risk/trade, position 0.5%.
Can Maximum Drawdown Predict Future Losses?
No, Maximum Drawdown cannot predict future losses reliably, as it reflects past events without accounting for changing market conditions or black swans in Forex. Think of it as a rearview mirror, useful for patterns but blind to tomorrow.
Past MDD shows strategy stress points, like high-vol pairs. But 2022’s rate hikes crushed old models.
Markets evolve: Post-COVID carry trades spiked MDD unpredictably.
Studies by Van Tharp confirm: Historical MDD correlates 30% with future max.
Use it probabilistically. Monte Carlo sims project ranges from past data.
Rhetorical: Ever seen a low-MDD strategy fail? Regime shifts happen.
Combine with forward tests. Live MDD diverges 20-50% from backtests.
Limitations: Ignores sequence risk. Early drawdown kills compounding.
Still valuable: Avoid strategies over 30% historical MDD.
Build buffers: 2x expected MDD in capital.
Psych edge: Prepares for pain, reducing panic sells.
In sum, it’s directional, not prophetic. Pair with stress tests.
Forward-walk tests bridge gaps. Tools like MT4 strategy tester run out-of-sample.
Trader tip: If MDD doubled lately, scale down.
How Does Maximum Drawdown Compare to Other Forex Risk Metrics?
Maximum Drawdown excels in showing worst-case loss depth, volatility measures standard deviation of returns, Sharpe ratio assesses risk-adjusted performance, and win rate tracks profitable trade percentage. Let’s compare across criteria like depth, predictability, and usability.
Drawdown depth: MDD wins for max pain, volatility averages swings (e.g., 2% ATR on EUR/USD).
Sharpe: Return/volatility ratio. High Sharpe low vol beats low MDD high vol.
Win rate: 60% sounds good, but ignores sizes. MDD captures full impact.
Data from Investopedia: Sharpe >1 good, MDD <15% elite.
Usability: MDD visual on charts, volatility via Bollinger, Sharpe Excel calc.
Competitive edge: MDD for survival, Sharpe for efficiency.
Example: Strategy A: 10% MDD, 1.2 Sharpe, 55% win. B: 25% MDD, 1.5 Sharpe, 70% win. Pick A for capital safety.
Research by AQR: MDD predicts 40% of blowups better than vol.
In Forex, leverage amplifies all. MDD stands out for equity protection.
Combine: Calmar ratio = Return/MDD. Over 0.5 solid.
Volatility suits options, win rate beginners.
Bottom line: MDD as anchor metric.
Advanced Questions About Maximum Drawdown in Forex Trading
Advanced questions address performance ratios, recovery methods, historical examples, automated trading differences, leverage effects, comparisons to other metrics, and strategy optimization using maximum drawdown in Forex.
Furthermore, these topics provide traders with tools to assess and mitigate risks beyond basic definitions.
What is the Calmar Ratio and How Does It Relate to Maximum Drawdown?
The Calmar Ratio measures a trading strategy’s performance by dividing the annualized return by the maximum drawdown, offering a risk-adjusted metric where higher values indicate better returns relative to peak losses. For instance, a Calmar Ratio of 3 means the strategy generates three times the annualized return compared to its worst drawdown percentage. This ratio directly ties to maximum drawdown because it uses that peak decline as the denominator, normalizing performance against the largest equity drop.

Traders favor it over Sharpe Ratio in Forex due to its focus on actual drawdowns rather than volatility. Data from backtests on platforms like Myfxbook shows strategies with Calmar Ratios above 1 perform reliably in trending markets, while those below 0.5 often fail in ranging conditions.
You’ll notice its simplicity appeals to retail traders managing high-leverage accounts.
- Calculate it as (Annualized Return / Maximum Drawdown) x 100 for percentage form
- Aim for ratios above 2 in Forex pairs like EUR/USD for sustainable edges
- Compare across strategies to select those with balanced growth versus drawdown exposure
How Do You Recover from a Large Maximum Drawdown in Forex?
Recovery from a large maximum drawdown requires compounding gains at a rate higher than the drawdown percentage, often taking extended time due to the math of percentage losses. If your account drops 50%, you need a 100% gain from the bottom to break even, not 50%. Time factors compound this, as consistent small wins (say 2% monthly) might take 18-24 months to recover a 40% drawdown.
Start by reducing position sizes to 0.5% risk per trade, preserving capital while rebuilding. Use trailing stops to lock profits early. Psychological reset helps, like demo trading similar setups post-drawdown.
Forex examples show pairs like USD/JPY recoveries post-2011 earthquake averaged 12 months with 1.5% average monthly returns.
- Apply the formula: Recovery Gain % = (1 / (1 – Drawdown %)) – 1
- Track recovery time with equity curve analysis in MT4 journals
- Incorporate partial profit-taking to shorten recovery phases
What are Historical Maximum Drawdowns in Major Forex Pairs?
Historical maximum drawdowns in major Forex pairs reveal vulnerability during crises, with EUR/USD hitting a 25% drawdown from 2008-2010 amid the financial crisis, and GBP/USD suffering 28% in 2016 post-Brexit vote. These peaks measured from local highs to subsequent lows on monthly charts underscore event-driven risks.
EUR/USD’s 2011 debt crisis drawdown reached 22%, while GBP/USD’s 2022 mini-budget turmoil caused 15% drops in weeks. Data from TradingView and Dukascopy archives confirm ranging pairs like USD/CHF saw milder 12-18% drawdowns versus volatile GBP crosses.
Such history guides position sizing, as exceeding half historical MDD signals over-risk.
- EUR/USD: 1985 Plaza Accord (18%), 2020 COVID (12%)
- GBP/USD: 1992 Black Wednesday (over 30% intraday equivalent)
- Use these for expectancy models in live trading
Is Maximum Drawdown Different in Automated Forex Trading?
Yes, maximum drawdown in automated Forex trading differs due to EA-specific behaviors like martingale scaling or grid systems, which amplify drawdowns during prolonged trends absent in manual trading. Backtesting reveals EAs often show clustered drawdowns from over-optimization, unlike discretionary trades with human intervention.
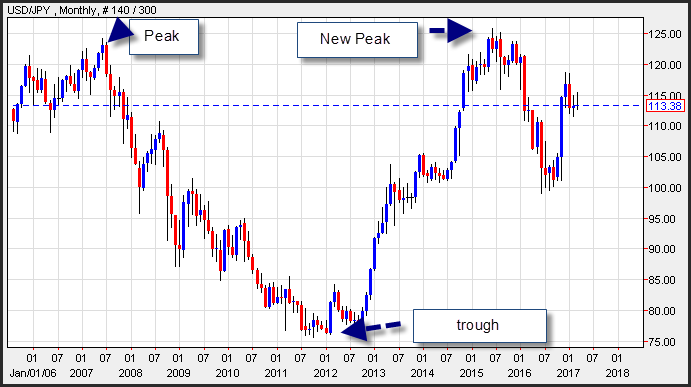
MT4/MT5 backtests highlight floating drawdowns peaking higher in EAs (up to 60% in scalpers) versus realized ones in manual setups. Rare metrics like relative drawdown (percentage of current equity) spike faster in bots ignoring news events.
Optimization via walk-forward analysis mitigates this, ensuring out-of-sample MDD stays under 20%.
- Analyze via MT5 Strategy Tester’s drawdown graph for peak-to-trough
- Distinguish absolute (fixed amount) vs. relative MDD in EA reports
- Stress-test with variable spreads to simulate live discrepancies
How Does Leverage Impact Maximum Drawdown in Forex?
Leverage amplifies maximum drawdown by magnifying losses on equity curves, turning a 2% price move into 20% account depletion at 100:1 ratios common in Forex. High leverage steepens drawdown slopes, as a $10,000 account with 500:1 leverage risks full wipeout on 0.2% adverse moves per micro-lot.
Lower leverage (10:1-30:1) flattens curves, allowing 10-15% price swings before 20% MDD. Broker data from IC Markets shows high-leverage accounts average 35% MDDs versus 15% for conservative ones.
Adjust by matching leverage to strategy volatility, using 1:50 max for trend-following.
- Formula effect: MDD_Leveraged = MDD_Base x Leverage Ratio
- Monitor margin calls as early drawdown warnings
- Pair with stop-losses scaled inversely to leverage
What is the Difference Between Maximum Drawdown and Average Drawdown?
Maximum drawdown captures the single largest peak-to-trough decline, a worst-case event metric, while average drawdown averages all declines, reflecting ongoing pullbacks. Max DD spikes during black swans (e.g., 40% once), but average DD stays low (5-10%) in winning strategies.

This distinction matters in Forex, where max DD tests survival, and average informs drawdown frequency. Myfxbook stats show top EAs with 15% max DD but 4% average, signaling resilience.
Use both: cap max at 25%, target average under 5%.
- Max DD: Absolute worst equity drop, directional
- Average DD: Mean of multiple dips, probabilistic
- Track via expectancy: (Win Rate x Avg Win) / Avg DD
How Can Maximum Drawdown Be Used in Forex Strategy Optimization?
Maximum drawdown aids Forex strategy optimization through Monte Carlo simulations and stress testing, randomizing trade sequences to predict worst-case MDDs beyond backtests. Run 1,000 iterations in tools like Quant Analyzer to ensure 95% scenarios stay under 20% MDD.

Stress tests apply historical crises (e.g., 2015 CHF peg snap) to forward-test resilience. Optimize by minimizing MDD while maximizing profit factor above 1.5.
Forex pairs benefit differently: scalpers tolerate higher simulated MDDs than swing strategies.
- Monte Carlo: Reshuffle trades for drawdown distribution
- Stress: Multiply volatility by 1.5-2x for extreme scenarios
- Iterate parameters until MDD/profit ratio stabilizes