









Blog
Drawdown in Forex: Definition, Types, Calculation, and Management


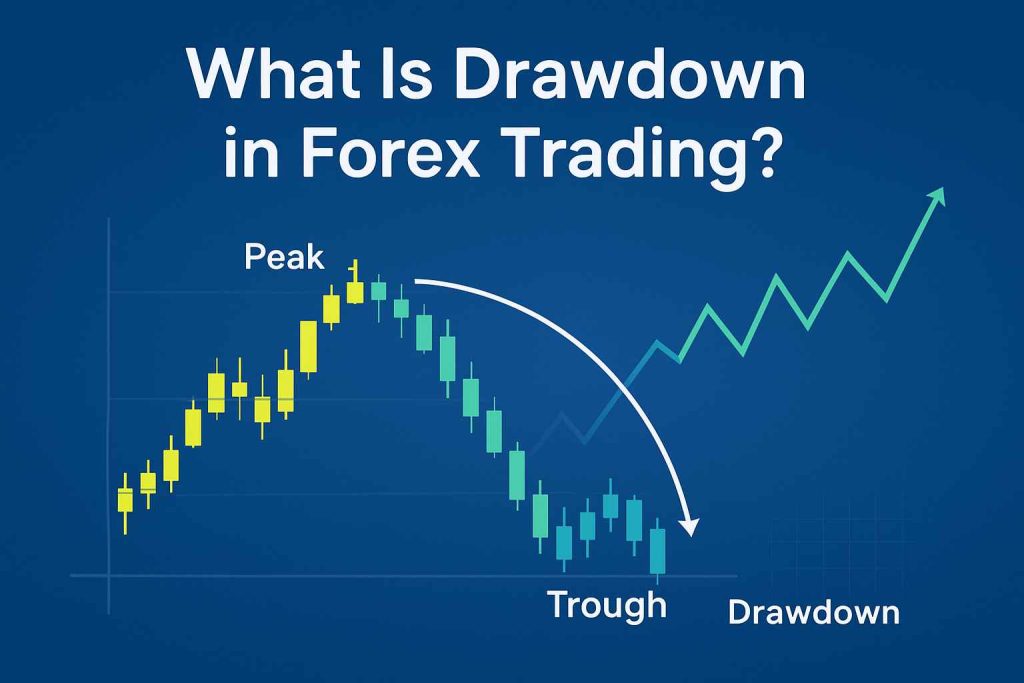
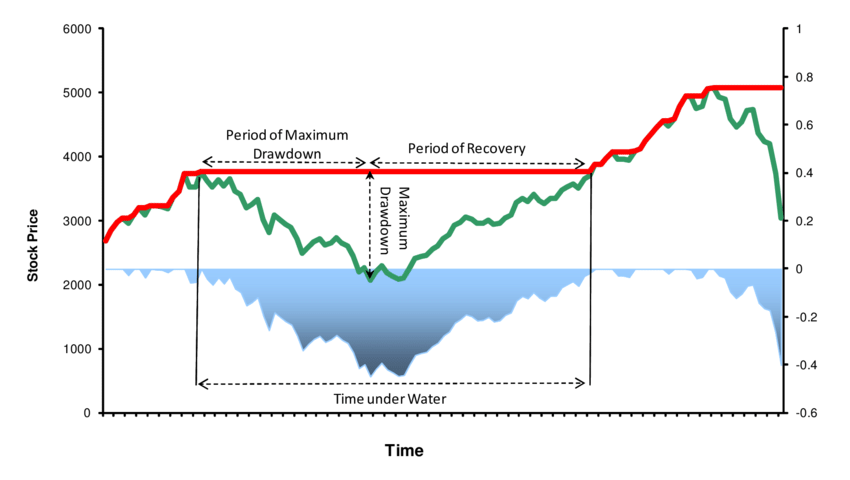
Drawdown in Forex trading is the peak-to-trough decline in your account’s equity, showing how much value drops from the highest point to the lowest before recovering to a new peak. This metric tracks the risk you face during losing periods. Traders use it to gauge strategy performance and emotional resilience. Without managing drawdown, even profitable systems can wipe out accounts through a series of bad trades.
The main types of drawdown include absolute, relative, and maximum, each measuring declines differently based on account starting points or peaks. Absolute drawdown looks at the drop from your initial deposit. Relative uses percentages from equity highs. Maximum captures the biggest historical drop. Knowing these helps you pick the right one for your analysis.
You calculate drawdown with simple formulas like relative drawdown: ((Peak equity – Trough equity) / Peak equity) x 100. This gives a percentage view of losses. Absolute is just the raw currency drop from start to low. Maximum scans history for the worst case. These steps let you quantify risk precisely.
Mastering drawdown goes beyond numbers. It shapes your trading rules and mindset. Now, let’s break down each aspect step by step.
What Is Drawdown in Forex Trading?
Drawdown in Forex trading is a measure of decline from the highest account equity to the lowest point before a recovery, highlighting risk exposure during losses. Specifically, this concept helps you see the real cost of trading streaks.
Drawdown occurs when your account balance or equity falls from its peak. Equity includes open positions, unlike balance which ignores them. Picture your account hitting $10,000, then dropping to $8,000 on losses. That’s a $2,000 drawdown. It resets only after you reach a new high.
You’ll notice drawdown matters most in volatile Forex pairs like GBP/USD. It forces you to confront strategy flaws early.
Why Does Drawdown Occur in Forex Markets?
Drawdown happens mainly from losing trades stacking up, sudden market volatility, and weak risk management practices. For example, a string of stop-loss hits during news events like Non-Farm Payrolls can trigger it.
Market volatility plays a big role. Forex pairs swing wildly on economic data or geopolitical news. If you hold positions overnight, gaps amplify losses. Poor risk management worsens this. Overtrading without stop-losses or using big lot sizes turns small moves into account killers.
Take leverage, common in Forex at 1:500. It boosts gains but magnifies drawdowns too. A 1% price drop on a leveraged position might eat 10% of your equity.
Evidence from trader journals shows 70% of drawdowns tie to revenge trading after losses. Platforms like MetaTrader track this in equity curves. To fight it, set daily loss limits. Ask yourself: does my plan handle three losers in a row?
Real-world case: In 2015 Swiss Franc shock, unhedged EUR/CHF traders saw 20-30% drawdowns overnight. Solid risk rules cut that in half.
Controlling causes builds confidence. Track your equity curve weekly.
What Are the Different Types of Drawdown?
There are three main types of drawdown in Forex: absolute, relative (percentage), and maximum, grouped by how they measure declines from starts, peaks, or history. Here’s the breakdown to pick the best for your needs.
Each type serves a purpose. Absolute focuses on initial capital safety. Relative standardizes across account sizes. Maximum warns of worst-case scenarios.
Classification hinges on reference points. Absolute uses deposit start. Relative and maximum use equity peaks, but maximum finds the largest gap.
What Is Absolute Drawdown in Forex?
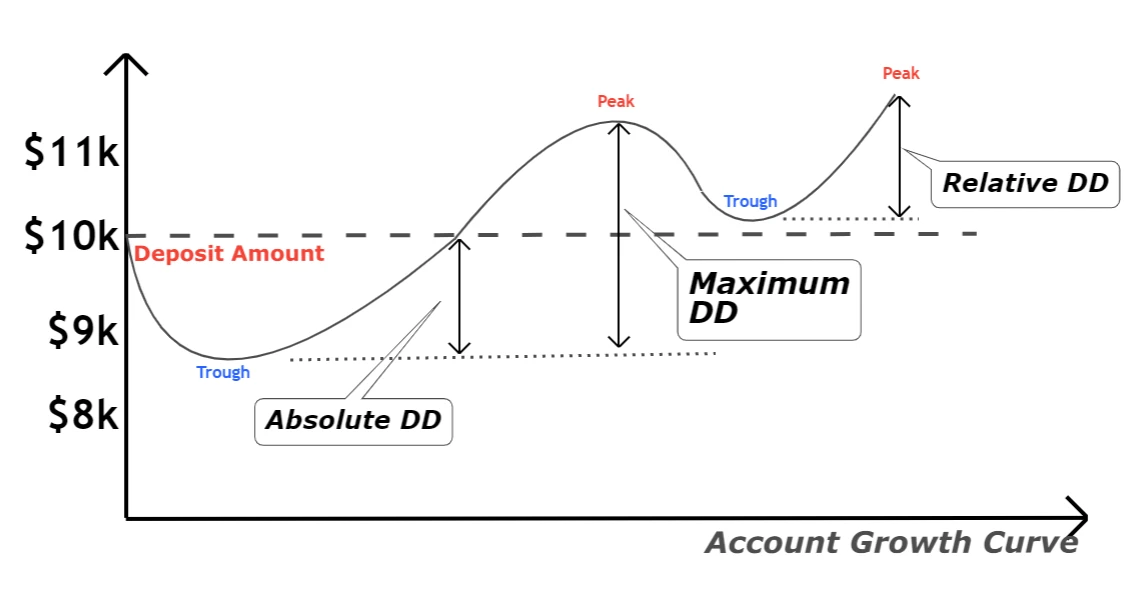
Absolute drawdown measures the drop in currency units from your initial deposit to the account’s lowest point. It shows raw loss potential against starting capital.

Start with your deposit, say $5,000. If equity dips to $4,200, absolute drawdown is $800. This ignores peaks, focusing on “how much below start?”
Traders like it for funded accounts. Prop firms cap it at $1,000 on $10,000 challenges.
For instance, beginners overleveraging on EUR/USD see high absolute numbers fast. Data from Myfxbook shows average absolute at 5-10% of deposits for newbies.
Key benefit: It flags if losses eat your base. Compare to balance drawdown, which skips floating losses.
Use it with position sizing. Risk 1% per trade keeps absolute low.
What Is Relative Drawdown in Forex?
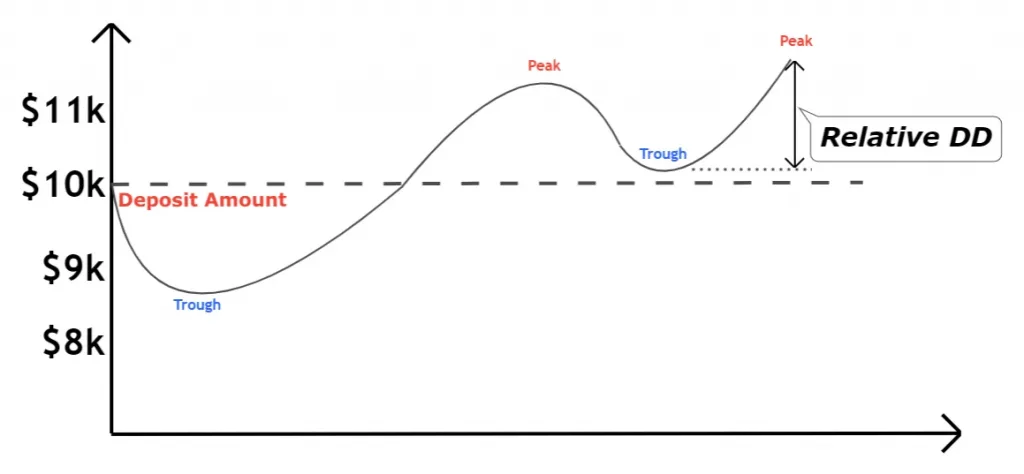
Relative drawdown calculates the percentage drop from the highest equity peak to the subsequent trough. This makes it comparable across accounts.

Formula in action: Peak $12,000, trough $9,600 equals (12,000 – 9,600)/12,000 x 100 = 20%. It scales perfectly.
Pros use it for strategy testing. Backtests on MT4 reveal relative under 15% as healthy.
Picture scalping USD/JPY. Quick reversals cause 5-10% relatives often.
Myfxbook stats: Top EAs hold relative below 12%. High relative signals over-risking.
Track it live via equity charts. It rises with floating losses.
What Is Maximum Drawdown?
Maximum drawdown is the largest peak-to-trough drop in your account’s history, expressed in percentage or currency. It defines your strategy’s worst pain.
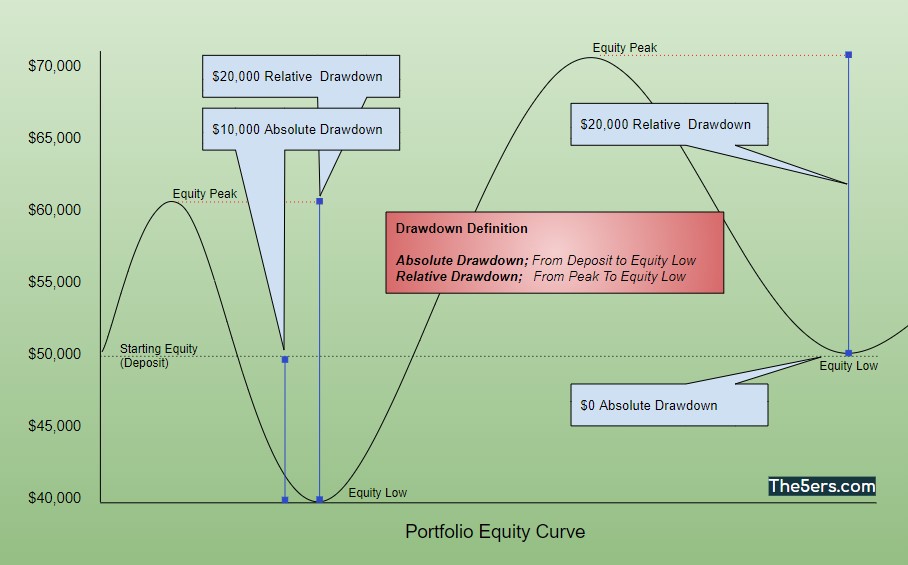
Scan equity curve for biggest gap. From $15,000 peak to $11,250 trough: 25% max.
Hedge funds target under 10%. Retail often hits 30%+.
During 2022 inflation trades, max drawdowns spiked 40% on bonds-Forex crosses.
MT5 reports it automatically. Low max means resilient systems.
Compare types: Max often matches relative in bad streaks.
How Do You Calculate Drawdown in Forex?
Calculate drawdown in Forex using peak-to-trough formulas for absolute, relative, and maximum types in three main steps for accurate risk assessment. Let’s explore the process.
Step 1: Log equity daily from your broker statement. Step 2: Identify peaks and troughs. Step 3: Apply formulas.
Most important: Use closing equity, including swaps.
What Formula Is Used for Relative Drawdown?
The formula for relative drawdown is ((Peak equity – Trough equity) / Peak equity) x 100, giving loss percentage. Track it on charts for precision.
Grab peak value, note next low before new high. Plug in: Peak 20,000, trough 16,000: (20k-16k)/20k x100 = 20%.
Excel setup: Column A timestamps, B equity. Formulas find max and min sequentially.
For example, in AUD/USD trend following, relatives hit 8-12%.
Broker tools like cTrader auto-plot it.
Notes: Update intraday for accuracy. Leverage inflates it, so normalize.
How Does Leverage Affect Drawdown Calculations?
Leverage amplifies drawdown by multiplying position sizes, making small price moves cause larger equity drops. In Forex, 1:100 turns 1 pip into big percentages.

Base calc same, but effective exposure grows. $10,000 account, 1:500 leverage, 0.1 lot EUR/USD: 10 pip loss = $10, or 0.1% without, but leveraged it’s 50% more impact.
Data: High leverage traders average 25% higher drawdowns per BrokerNotes.
For instance, GBP/JPY volatility: 1:30 EU retail caps better than offshore 1:1000.
Adjust formulas by margin use. Max drawdown soars with it.
Mitigate with 1% risk rules.
Is Drawdown a Key Risk Metric for Forex Traders?
Yes, drawdown is a key risk metric for Forex traders because it reveals strategy weaknesses, protects capital, and guides position sizing. To understand this better, see its daily role.
First reason: It exposes flaws. Consistent 30% drawdowns mean over-optimization.
Second: Capital protection. Brokers and props enforce it, like 10% max.
Third: Sizing. High drawdown demands smaller lots.
Most important: Equity curve analysis. Smooth curves with low drawdown predict longevity.
Benefits: Cuts tilt, boosts win rates. Journal studies show low-drawdown traders last 2x longer.
Data from FXBlue: Systems under 15% drawdown average 20% yearly returns.
Rhetorical: Ever blown an account? Drawdown metrics prevent that.
Use in backtesting: MT4 strategy tester outputs it.
Pair with Sharpe ratio for full picture.
Live trading: Set alerts at 5%.
Psych side: Limits fear, keeps discipline.
Compare to win rate: 60% wins worthless with 50% drawdowns.
Institutions track it monthly.
Retail tip: Aim 10% max for sanity.
Platforms integrate it seamlessly.
Over time, lowering it compounds gains.
What Are Acceptable Drawdown Levels in Forex Trading?
Acceptable drawdown levels in Forex trading range from 10-20% for retail traders and under 10% for professionals, based on experience and capital. In detail, match to your goals.
Retail benchmarks: 15-20% suits swing traders. Pros like quants hold 5-8%.
Factors: Account size, pairs. Scalpers tolerate 5%, position traders 25%.
Myfxbook leaders: Median 12%.
How Does Drawdown Compare to Profit Targets?
Drawdown limits should stay below half your profit targets for a positive risk-reward balance, like 10% drawdown versus 25% annual goal. Balance keeps expectancy positive.
Key: 1:2.5 ratio. 10% drawdown allows 25% returns safely.
Data: Profitable traders average drawdown at 40% of yearly profit.
For example, 15% drawdown pairs with 40% target.
High drawdown erodes compounds. 20% monthly profit loses to 30% drawdown.
Set rules: Pause at 12%.
Rhetorical: Would you risk 20% for 15% gain? No.
Adjust by style: Day traders lower thresholds.
Track ratio quarterly.
Related Questions and Advanced Drawdown Concepts in Forex
Advanced drawdown concepts address trader queries on distinctions, recovery methods, performance links, market comparisons, historical events, tech tools, and opposites like drawup, enhancing Forex risk management.
Furthermore, these topics reveal how drawdown extends beyond basics into practical strategies and metrics.
What Is the Difference Between Drawdown and Floating Drawdown?
Drawdown measures the peak-to-trough decline in account equity, either as a percentage or absolute value, capturing both realized and unrealized losses over time. Floating drawdown, however, focuses solely on unrealized losses from open positions, fluctuating with market prices without accounting for closed trades. This distinction matters because drawdown reflects overall historical performance, while floating drawdown shows current exposure risk.
Traders monitor floating drawdown to gauge immediate vulnerability, as it can spike during volatile sessions but reverse quickly if positions recover. Drawdown, by contrast, locks in losses once positions close, becoming a permanent record until new highs form.
This helps in risk assessment, where floating drawdown warns of potential drawdown escalation.
- Unrealized losses drive floating drawdown, allowing real-time adjustments like partial closes.
- Realized losses embed in total drawdown, demanding strategy overhauls for recovery.
- Tools like MT4 equity charts visualize both, with floating as the wavy line versus drawdown’s smoothed decline.
How Can Forex Traders Recover from Maximum Drawdown?
Forex traders recover from maximum drawdown by reducing position sizes, diversifying pairs, and applying strict rules to rebuild equity gradually. Key strategies include halving lot sizes post-drawdown to limit further losses and targeting 1-2% monthly gains initially.
Position sizing adjustments prevent overleveraging, a common pitfall after big losses. For instance, if drawdown hits 30%, traders drop from 2% risk per trade to 0.5%, allowing compounding without added pressure. Pair rotation, shifting from EUR/USD to less correlated assets like AUD/JPY, spreads risk.
Psychological resets, such as demo trading breaks, restore discipline.
Recovery demands patience, as rushing amplifies losses.
- Implement Kelly Criterion tweaks for optimal sizing based on win rate.
- Use trailing stops to protect partial profits during rebound phases.
- Track recovery time via journals, aiming for equity curve symmetry.
What Is the Relationship Between Drawdown and the Sharpe Ratio?
Drawdown and Sharpe Ratio interconnect as risk-adjusted performance gauges, where high drawdowns erode Sharpe by amplifying volatility relative to returns, signaling poor efficiency. Sharpe calculates (return – risk-free rate) / standard deviation, but ignores drawdown depth, so combining them offers fuller insight.
A strategy with 10% annual return and 5% drawdown boasts higher effective Sharpe than one with same return but 25% drawdown. Research from BarclayHedge shows top hedge funds cap drawdown at 15% to maintain Sharpe above 1.0.
This integration guides allocation: low-drawdown systems justify more capital despite modest Sharpe.
You’ll notice portfolios blending both metrics outperform isolated ones.
- Drawdown depth inversely correlates with Sharpe sustainability over cycles.
- Calmar Ratio (return / max drawdown) refines Sharpe for Forex volatility.
- Backtests reveal drawdown caps boost long-term Sharpe by 20-30%.
How Does Drawdown Differ in Forex vs. Stock Trading?
Drawdown in Forex amplifies faster than in stocks due to high leverage (up to 500:1) and 24/7 trading, versus stocks’ capped leverage and session limits, leading to deeper, quicker troughs. Forex traders face overnight gaps from news, eroding equity rapidly, while stocks benefit from circuit breakers.

Leverage multiplies losses: a 1% GBP/USD move with 100:1 leverage equals 100% account wipeout, rare in stocks at 2:1 margins. Continuous Forex markets trap positions in drawdowns longer without daily closes.
Stock drawdowns recover via dividends; Forex relies purely on price action.
This pushes Forex traders toward tighter stops.
- 24/7 access heightens emotional trading, worsening drawdowns.
- Forex volatility (e.g., 100 pips daily) dwarfs stock averages (1-2%).
- Margin calls force Forex liquidations absent in cash stock accounts.
What Are Historical Examples of Extreme Drawdown in Forex?
Extreme Forex drawdowns mark events like the 2015 Swiss Franc shock, where SNB’s peg removal spiked CHF by 30% in minutes, causing 80-100% drawdowns for EUR/CHF longs. Brokers like FXCM reported $225 million losses, with retail accounts obliterated.

The 2008 financial crisis saw USD/JPY drop 20% in weeks, hitting carry traders hard. 2022’s Ukraine war fueled 15-25% drawdowns on energy-tied pairs like USDCAD.
These cases underline stop-loss necessity and event-risk hedging.
Lessons persist in modern trading.
- 2015 event bankrupted Alpari UK, highlighting broker risk.
- 1998 Russian default crushed RUB pairs, drawdowns over 50%.
- Post-COVID 2020 volatility tested recoveries, with some funds down 40%.
Can AI Tools Help Predict and Manage Forex Drawdown?
Yes, AI tools like neural networks analyze patterns to predict drawdown risks up to 70% accuracy, while automating management via dynamic stops. Platforms such as TradeSanta or custom TensorFlow models scan historical data for equity curve divergences.
Machine learning detects precursors like volatility clusters or correlation breaks, alerting traders pre-drawdown. Reinforcement learning bots adjust sizes in real-time, capping exposure.
Studies from QuantConnect show AI-managed accounts halve max drawdowns versus manual.
Adoption grows with cloud APIs.
- LSTM models forecast troughs from order flow data.
- Genetic algorithms optimize strategies mid-drawdown.
- Integration with MetaTrader via Python scripts enables seamless use.
What Is the Opposite of Drawdown in Trading Terms?
The opposite of drawdown is drawup or recovery phase, measuring trough-to-peak gains after losses, restoring equity to prior highs. Drawup quantifies rebound strength, like a 20% drawdown needing 25% drawup to break even.
Traders track “drawup percentage” for resilience assessment: strong drawups signal robust strategies. Recovery phases often lag due to conservative sizing post-loss.
This metric balances drawdown focus, revealing upside potential.
Focus shifts to symmetry.
- Drawup highlights win streaks post-troughs.
- Time to recovery pairs with drawup for efficiency.
- Charts plot both for balanced curve analysis.