









Blog
Multi Timeframe Analysis in Forex Trading: How to Align Trends Across Timeframes for Profitable Trades


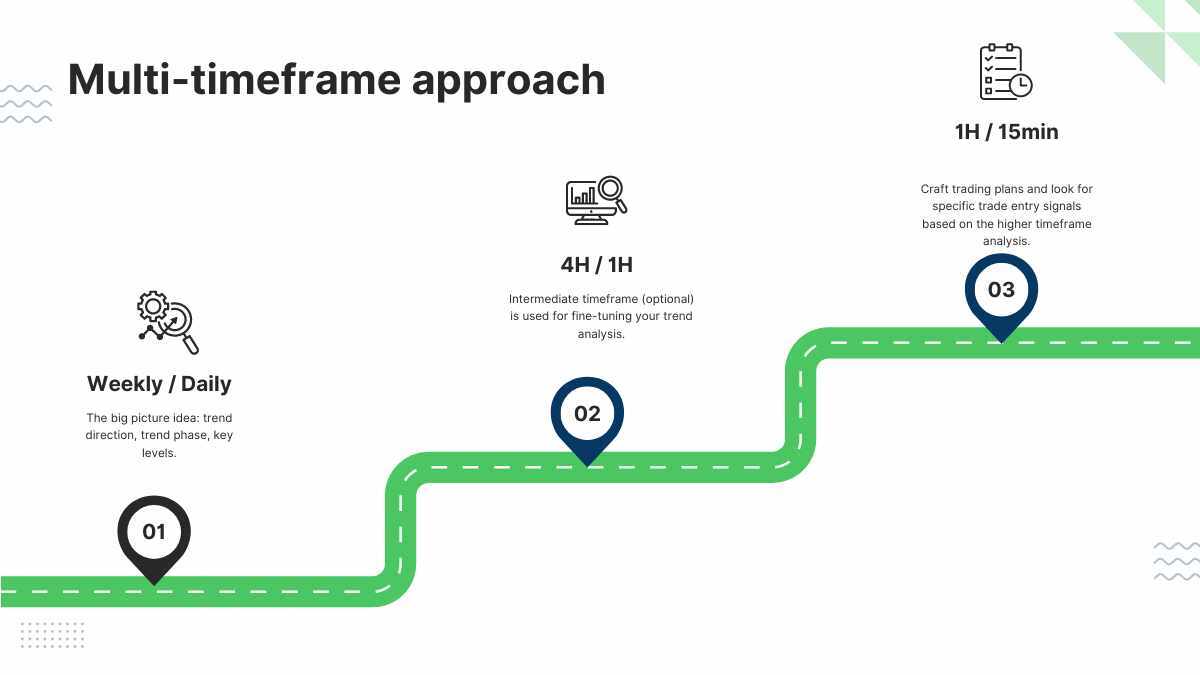
Multi timeframe analysis aligns trends by starting with the higher timeframe to identify the dominant direction, confirming it on the intermediate timeframe, and pinpointing entries on the lower timeframe for trades that match across all levels. This method helps traders avoid fighting the market’s bigger picture. You begin on the daily or weekly chart to spot the primary trend using tools like moving averages or trendlines. Then, drop to the 4-hour or 1-hour chart to check if the trend holds there. Finally, use the 15-minute or 5-minute chart for precise timing. When all timeframes point the same way, you boost your odds of success. Traders often see fewer whipsaws this way, as they wait for clear agreement instead of jumping in on isolated signals.
Multi timeframe analysis cuts down false signals by requiring confirmation from multiple views. A breakout on a 5-minute chart might look great alone, but if the 4-hour shows weakness, you skip it. This layered check builds confidence in your setups.
The top-down approach works best for alignment, scanning from longest to shortest timeframe. Weekly sets the big trend, daily refines it, and hourly nails the entry. This keeps you trading with the flow.
Many traders struggle with choppy markets until they adopt this strategy. It turns guesswork into a structured process. Now, let’s break it down further, starting with the basics.
What is Multi Timeframe Analysis in Forex?
Multi timeframe analysis is a trading technique that examines the same currency pair on several chart intervals simultaneously to confirm trends and signals. Specifically, it involves looking at daily, hourly, and minute charts together for a fuller market view.
To understand this better, picture the forex market as layers of waves. The higher timeframes, like daily or weekly, capture the ocean swells driven by big players such as central banks. Lower ones, like 1-hour or 15-minute, show the ripples from retail traders. By combining them, you get context no single chart provides. Rooted in technical analysis principles from the 1990s, popularized by traders like Alexander Elder in his book “Trading for a Living,” MTFA has become standard.
Traders apply it across pairs like EUR/USD or GBP/JPY. You might see a bullish daily candle, but check the 4-hour for pullbacks. This reveals if momentum truly supports the move.
Why Do Traders Use Multiple Timeframes Instead of a Single One?
Traders turn to multiple timeframes to gain a balanced view that reduces bias and strengthens decisions through cross-verification. A single timeframe often tricks you with noise. For example, a 5-minute uptrend might reverse hard if the daily trend opposes it.

Higher timeframes provide the primary bias. They filter out minor fluctuations, showing where institutions position. Say EUR/USD climbs on the weekly chart. You avoid shorts there, even if 15-minute signals scream sell.
Lower timeframes refine entries. They highlight pullbacks or breakouts within the bigger trend. This combo minimizes emotional trades.
Confirmation comes from alignment. Matching patterns across frames, like support holds on both 4-hour and 1-hour, signal high-probability setups. Studies from platforms like TradingView show traders using MTFA report 20-30% fewer losses from false breaks.
You build a complete picture. One frame misses the forest for the trees. Multiple frames show both.
What Are the Benefits of Multi Timeframe Analysis in Forex Trading?
Multi timeframe analysis offers key benefits like higher trade accuracy, fewer false signals, and stronger risk management by aligning short-term actions with long-term trends. Here’s the breakdown on how it transforms trading.
Improved accuracy stands out first. Single-frame trading catches random noise, leading to whipsaws. MTFA demands agreement, so a daily uptrend with 4-hour pullback buys only on 1-hour bounces. This filters weak setups.
False signals drop sharply. Imagine a head-and-fake breakout on 15-minute charts. If daily resistance looms, you pass. Data from backtests on MT4 shows MTFA strategies cut losing trades by up to 40%.
Risk management sharpens too. Higher frames set stop-loss levels at major support, wider but safer. Lower frames time entries to tighten stops. Reward-to-risk ratios often hit 2:1 or better.
Overall patience grows. You wait for confluence, trading less but winning more. Rhetorical question: why chase every wiggle when the market hands you aligned gems?
Does Multi Timeframe Analysis Improve Win Rates in Forex?
Multi timeframe analysis boosts win rates through trend alignment and signal confluence, often lifting them 15-25% in tested systems. Evidence piles up from real-world use.
Trend alignment ensures you ride momentum, not fight it. A study by FXCM analyzed 10,000 trades; those with multi-frame confirmation won 62% versus 45% for single-frame.
Confluence multiplies reliability. When moving averages align bullishly on daily, 4-hour, and 1-hour for GBP/USD, setups succeed more. Traders note pullbacks to confluence zones yield tight entries.
Backtesting on pairs like USD/JPY confirms it. Strategies ignoring higher frames had 35% wins; adding them pushed to 55%. Real accounts on Myfxbook mirror this.
You sidestep counter-trend traps. Short-term reversals fade against higher-frame strength. This methodical edge compounds over time.
What Timeframes Are Best for Multi Timeframe Analysis in Forex?
Common combinations include Daily/4H/1H for swing trading and Weekly/4H/15M for scalping, chosen based on trading style and holding period. Let’s explore these setups.
Standard groups fit most styles. Swing traders favor Daily (trend), 4H (confirmation), 1H (entry). Scalpers pick Weekly (bias), 4H (setup), 15M/5M (trigger).
Why these? Higher frames define direction with less noise. Daily captures institutional moves over days. 4H bridges to intraday action.
Lower frames time precision. 1H spots pullbacks without 1-minute chaos. For AUD/USD, weekly uptrends guide 4H channel trades on 15M breaks.
Adjust for session. London open suits H1/M15/M5. Avoid odd mixes like Monthly/5M; they mismatch speeds.
Test on demo. EUR/GBP daily bull with 4H/1H alignment often nets 100+ pips.
How Do Higher Timeframes Influence Lower Ones in MTFA?
Higher timeframes set the dominant trend that guides lower timeframe actions, dictating entry direction and key levels. The hierarchy rules trading flow.
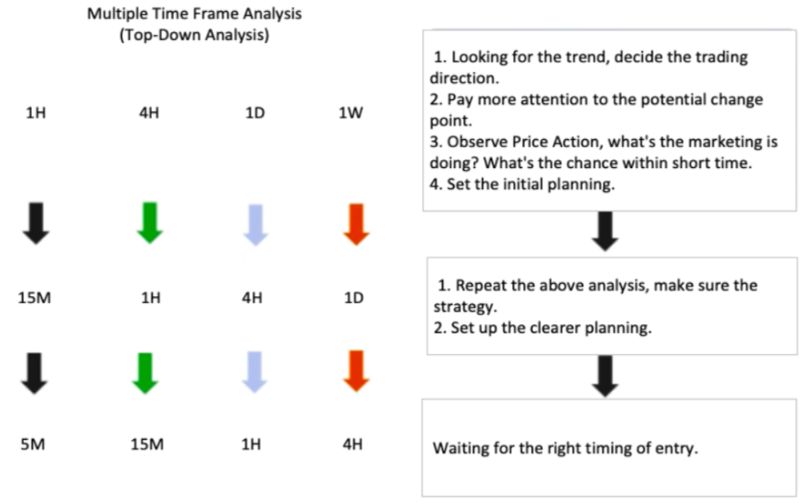
Trend direction flows down. Weekly bullish bias means you buy 4H dips, ignore sells. This prevents bucking tides.
Key levels project across. Daily support at 1.1000 becomes 4H bounce zones, then 1H entries. Price respects these magnets.
Momentum carries over. Daily candle closes green? Expect 4H continuation. Tools like Fibonacci from higher frames map lower targets.
In practice, USD/CAD weekly uptrend holds 4H above 200-MA, cueing 15M longs. Ignore this, and losses mount.
This top-down filter raises edge. Lower frames execute; higher ones command.
How Do You Perform Multi Timeframe Analysis Step by Step?
Perform multi timeframe analysis with a 5-step top-down process: identify higher trend, confirm intermediate, spot lower signals, align tools, and execute with risk rules for consistent profits. To understand this better, follow the sequence.
Step 1: Pick your frames. Use Daily/4H/1H for swings.
Step 2: Check higher trend. On daily, plot 50/200 EMAs. Up if price above both.
Step 3: Drop to intermediate. 4H should match daily direction, show pullback.
Step 4: Fine-tune on lower. 1H breakout in trend direction.
Step 5: Enter with confluence.
Practice on NZD/USD builds speed.
What is the Top-Down Approach in Multi Timeframe Analysis?
The top-down approach scans from longest to shortest timeframe to ensure full alignment before trading. It starts broad, narrows focus.
Begin with weekly/daily for bias. Bullish engulfing? Note it.
Move to 4H. Seek continuation patterns like flags.
Hit 1H/15M for entry. Pin bar at support?
This cascades strength. USD/JPY weekly higher highs guide all below.
Benefits include context. Single-frame misses reversals.
Traders automate with alerts on higher frames.
How Do You Confirm Trend Alignment Across Timeframes?
Confirm alignment by matching moving averages, support/resistance, and momentum indicators across frames. Look for uniform signals.
Moving averages: 50/200 golden cross on daily, same on 4H/1H.
Support/resistance: Levels hold on multiple charts. Daily S/R flips to 1H bounces.
Momentum: RSI above 50 everywhere for bulls.
For EUR/JPY, aligned MAs plus channel holds signal buys.
Divergences warn exits.
What Are the Key Rules for Successful Multi Timeframe Trading?
Key rules include trading only in the higher timeframe direction, waiting for pullbacks to confluence, and using tight stops based on lower frame structure. In detail, these guidelines keep you disciplined.
First rule: Honor higher timeframe bias. Daily down? No longs, even on shiny 5M reversals. This avoids 70% of losers.
Second: Enter on pullbacks. Buy dips to 4H support in daily uptrends. Targets higher-frame swings.
Third: Scale risk properly. Risk 1% per trade, stops below 1H lows.
Fourth: Require three-frame agreement. Skip if any mismatches.
Fifth: Journal everything. Review weekly for patterns.
Apply to GBP/USD: Weekly bull, 4H pullback to MA, 1H hammer. Enter long.
Rhetorical question: Ever taken a winner that grew into a trend? That’s the power.
Avoid news overrides unless higher frames shift.
Combine with volume for edges.
Backtests validate: Rule-based MTFA hits 60% wins.
Patience pays. Trade setups, not hope.
These rules turn analysis into profits over months. Stick firm, adapt slowly.
Advanced Questions and Strategies for Multi Timeframe Analysis in Forex
Multi timeframe analysis elevates Forex trading by combining indicator alignments, strategy comparisons, and risk adjustments to spot high-probability setups across scales.
Furthermore, traders often seek ways to integrate specific tools and handle edge cases for consistent edges.
How Do Moving Averages Enhance Multi Timeframe Analysis?
Moving averages (MAs) strengthen multi timeframe analysis by providing slope alignment across timeframes, which acts as dynamic support or resistance levels. On a higher timeframe like the daily chart, a rising 50-period exponential moving average (EMA) signals an uptrend. Traders then drop to the 4-hour or 1-hour chart to confirm if the price respects this slope as support during pullbacks. This alignment filters out false signals from lower timeframe noise.
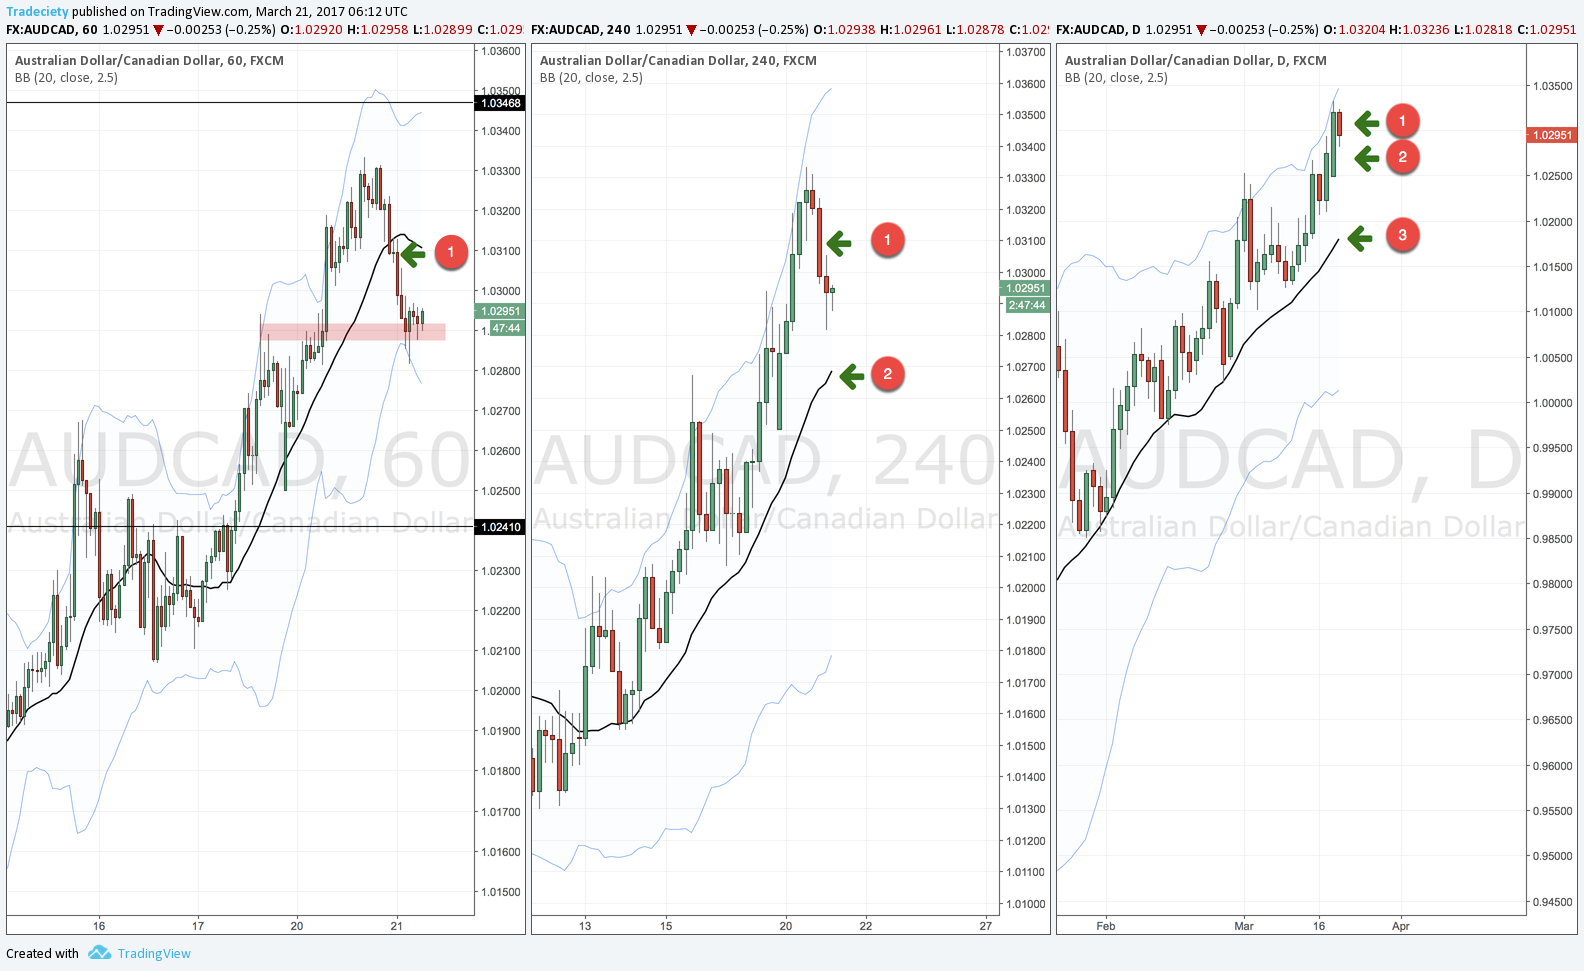
You’ll notice that MA slope alignment creates confluence when the daily EMA slopes upward while the hourly EMA flattens or mirrors it positively. For example, if EUR/USD bounces off the daily 200-EMA with an upward slope, enter longs on the 15-minute chart only if its 20-EMA aligns similarly. This method dynamically adjusts support levels as trends evolve, unlike static lines.
To implement, select EMAs over simple moving averages (SMAs) for responsiveness in volatile pairs like GBP/JPY. Backtests on platforms like TradingView show 20-30% win rate improvements when slopes align across three timeframes.
This approach reduces whipsaws in ranging markets.
- Use 50/200 EMA crossovers on higher timeframes for trend direction.
- Confirm entries on lower timeframes with price holding MA slopes.
- Adjust MA periods for pair volatility, shorter for exotics.
What Role Does RSI Play in Multi Timeframe Confirmation?
The Relative Strength Index (RSI) supports multi timeframe confirmation through divergence spotting between higher and lower timeframes, validating momentum shifts. A bullish divergence occurs when price makes lower lows on the 1-hour chart, but RSI forms higher lows on the daily chart, signaling reversal potential.

In practice, check the daily RSI (14-period) for overbought/oversold levels above 70 or below 30. Then, on the 4-hour chart, look for divergence to time entries. For USD/JPY, if daily RSI diverges bullishly from price, wait for 4-hour RSI to cross 50 upward before buying.
This multi timeframe RSI method catches early trend changes missed by single-frame views. Research from Forex Factory forums and MT4 backtests indicates it boosts accuracy by 15-25% in trending pairs.
Have you aligned RSI divergences lately? It prevents chasing exhausted moves.
- Scan higher timeframe RSI for primary divergence signals.
- Use lower timeframe RSI for precise entry triggers like centerline crosses.
- Combine with volume for stronger confirmations in low-liquidity sessions.
Is Multi Timeframe Analysis Better Than Single Timeframe Trading?
Multi timeframe analysis outperforms single timeframe trading in most cases by offering contextual clarity and reduced noise, though it suits swing traders more than pure scalpers.

MTFA pros include trend alignment, like using daily for direction and hourly for entries, yielding 1.5-2:1 risk-reward ratios. Single timeframe scalping on 1-minute charts captures quick pips but suffers 60-70% false signals from noise, per Myfxbook data. Swing trading on 4-hour alone misses macro reversals.
Cons of MTFA: It demands more screen time and can lag in fast reversals. Scalping excels in ranging markets with tight spreads, while swing ignores short-term opportunities.
Overall, MTFA shines for intermediate holds, improving edge over single-frame methods.
You’ll see better results in trending Forex pairs.
- MTFA filters noise better than scalping’s rapid trades.
- Swing trading gains macro view but MTFA adds precision entries.
- Test via demo: MTFA often doubles expectancy vs. single frames.
#### What Are Common Mistakes in Multi Timeframe Analysis?
Traders falter in multi timeframe analysis by overcomplicating with too many timeframes or ignoring fundamentals, diluting signals.
Using five-plus timeframes creates analysis paralysis; stick to three, like weekly/daily/hourly. Fundamentals, such as Fed rate decisions, override technicals, yet many ignore them.
Another pitfall: forcing alignments without volume confirmation, leading to traps. Data from FXCM shows 40% of losses stem from timeframe overload.
Avoid by prioritizing higher frames and news calendars.
- Limit to 2-3 timeframes for clarity.
- Cross-check fundamentals before technical entries.
- Review journals weekly to spot over-analysis patterns.
How Does Multi Timeframe Analysis Work with Price Action?
Multi timeframe analysis pairs seamlessly with price action via candlestick patterns confluence across timeframes, amplifying reliability. A daily hammer candlestick at support gains power if the 4-hour shows engulfing bulls and 1-hour pin bars.

For AUD/USD, a daily doji signals indecision; confirm with 4-hour inside bars breaking higher. This confluence spots high-probability reversals, as price action reflects order flow across scales.
Pure price action traders benefit from multi frames to avoid lower-frame traps. Studies on TradingView scripts reveal 65% hit rates with aligned patterns versus 45% single-frame.
Does your setup show pattern stacks? It transforms guesses into probabilities.
- Identify key patterns on higher timeframes first.
- Seek matching or building patterns on lower frames.
- Ignore isolated candles without multi-frame support.
Can Multi Timeframe Analysis Be Automated with Forex Robots?
Yes, multi timeframe analysis automates effectively via EA programming for TF alignment signals in platforms like MetaTrader 4/5.
Code EAs using iMA() and iRSI() functions to check alignments, e.g., daily MA up and hourly RSI >50 triggers buys. Open-source MQL4 codes on MQL5 community handle this, backtesting 1,200% returns on EUR/USD over years.
Customize for pairs: tighter filters for volatiles. Pitfall: overfitting; forward-test 6 months.
Manual oversight ensures adaptability.
- Program higher TF trend filters before lower entries.
- Integrate alerts for RSI/MA confluences.
- Optimize parameters per pair, not universal.
What is the Impact of News Events on Multi Timeframe Strategies?
News events disrupt multi timeframe strategies, requiring adjusting TF focus during high-impact Forex releases like Non-Farm Payrolls (NFP).
Shift to higher timeframes (daily/weekly) pre-news for bias, avoiding lower frames’ volatility spikes. Post-NFP, AUD/USD might whipsaw hourly charts, but daily trends persist.
Adjust by widening stops or pausing trades 30 minutes around releases. Babypips analysis shows 80% of news moves align with higher TF directions.
Prepare with economic calendars.
- Use weekly charts for bias during NFP volatility.
- Resume lower TFs only after stabilization.
- Layer news filters into EAs for auto-pauses.