









Blog
Trend Following Strategy in Forex: How It Works, Key Indicators, Entry Rules, and Risk Management


Trend following in Forex involves spotting established market directions and trading along with them using tools like moving averages and ADX, entering on pullbacks or breakouts with strict stop-losses and trailing exits to capture profits while managing risks. This approach relies on momentum rather than predicting reversals. Traders wait for clear price movements in currency pairs, such as EUR/USD or GBP/JPY, before committing capital. You identify trends through price action and indicators, enter trades in the trend’s direction, and exit when momentum fades. Risk management keeps losses small through position sizing and stops placed beyond recent swings.
Key indicators for trend following include moving averages for direction, ADX for strength above 25, and Parabolic SAR for trailing stops. These tools filter out noise in volatile Forex markets. Moving average crossovers signal entries, while ADX confirms if a trend is worth trading. Parabolic SAR helps with dynamic exits.
Entry rules focus on breakouts from consolidation or pullbacks to support in uptrends for longs, and resistance in downtrends for shorts, always with confirmation from volume or indicators. For example, buy EUR/USD on a pullback to the 50-period EMA during an uptrend. This reduces false signals and aligns with momentum.
Trend following suits patient traders who thrive on sustained moves driven by economic forces. Now, let’s break down the strategy step by step, starting with its core definition.
What Is a Trend Following Strategy?
A trend following strategy is a systematic trading method that identifies ongoing market momentum and positions trades in that direction to profit from continuations rather than reversals. Specifically, this approach assumes prices move in persistent directions for periods, driven by collective trader behavior.
Trend following stands out because it does not forecast tops or bottoms. Instead, you react to what the market shows. Think of it as surfing waves: you wait for a swell, ride it, and jump off before it crashes. In Forex, this means trading pairs like USD/JPY when they show clear upward or downward bias over days or weeks.
The core concept rests on three ideas. First, markets trend about 30% of the time, with the rest in ranges, so you skip choppy periods. Second, trends emerge from imbalances like interest rate differentials. Third, discipline beats prediction. Historical data from commodities and Forex backtests show trend systems yielding positive expectancy over long periods, even with drawdowns.
You’ll notice successful trend followers like Richard Dennis of the Turtle Traders fame, who turned novices into millionaires in the 1980s using simple rules. They bought breakouts above 20-day highs and sold below lows, proving simplicity works.
In practice, you scan multiple pairs daily. For instance, if AUD/USD climbs steadily with higher highs and lows, you go long. This method shines in Forex due to 24/5 liquidity and leverage, but demands patience during flat markets.
Traders often backtest on platforms like MetaTrader 4. A basic system might use a 200-day moving average filter: trade only above it for longs. Over 10 years on EUR/USD, such rules capture major moves like the 2014-2015 bull run.
Why does this persist? Human psychology herds into momentum, amplified by algorithms today. But it fails in ranging markets, teaching you to sit out.
Overall, trend following builds wealth through compounding winners, not frequent trades. It requires a mindset shift from scalping to holding positions for 100+ pips.
How Does Trend Following Work in the Forex Market?
Trend following works in Forex by identifying directional momentum in currency pairs through price structure and indicators, entering aligned trades, and exiting on weakness to capture sustained moves. In detail, here’s the breakdown from identification to profit taking.
What Constitutes a Valid Trend in Forex?
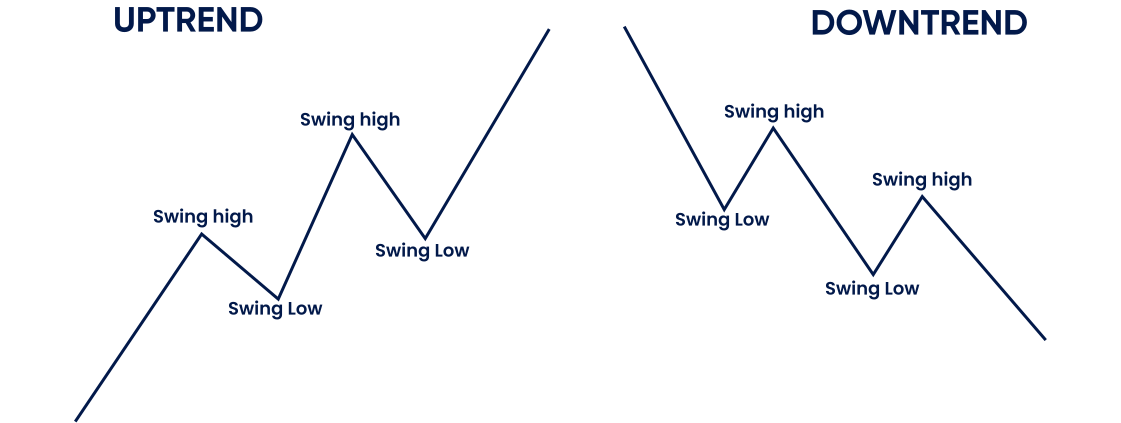
A valid trend in Forex features a series of higher highs and higher lows for uptrends, lower highs and lower lows for downtrends, or flat price action for sideways markets. Specifically, uptrends show bullish candles pushing beyond prior peaks with pullbacks not breaching key lows.
Price action defines trends best. For uptrends, look for at least three swings: low1 to high1, pullback to low2 (higher than low1), then high2 above high1. This confirms buyer control. Downtrends mirror with sellers dominating.
Sideways markets lack this structure, oscillating in channels. Use higher timeframe confirmation, like daily charts for H1 trades, to avoid whipsaws.
For example, in EUR/USD’s 2022 downtrend, prices made lower lows amid Fed hikes, valid until a higher low formed in late 2022.
Tools aid visually: connect swing points with trendlines. A break below an uptrend line signals potential end.
Evidence from price studies shows trends last 20-50 bars on average in majors, per John Murphy’s technical analysis work.
Main point 1: Measure steepness with angle, shallow trends persist longer.
Main point 2: Volume confirms, rising on breakouts.
Main point 3: Multi-timeframe alignment boosts reliability, like H4 trend matching daily.
Why Do Trends Form in Forex Markets?
Trends form in Forex from sustained buying or selling pressure due to economic data releases, central bank policies, interest rate gaps, and geopolitical shocks creating directional momentum. For instance, higher US rates spark USD strength, pushing pairs like EUR/USD lower over months.
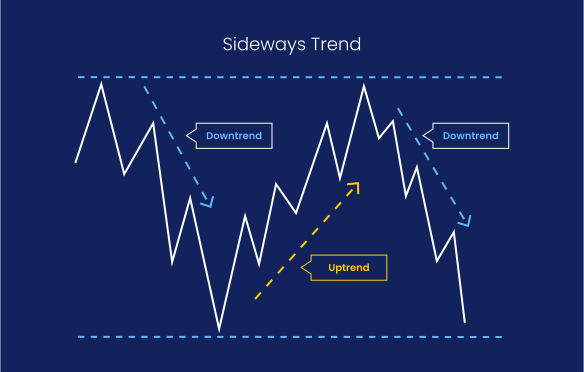
Economic data drives 70% of moves. Non-farm payrolls or GDP beats fuel trends. Interest differentials, like RBA vs. Fed, sustain AUD/USD uptrends.
Geopolitics adds fuel: Ukraine war in 2022 boosted USD as safe haven.
Central banks amplify via forward guidance. ECB dovishness vs. BOJ yield curve control trended USD/JPY from 110 to 150 in 2022.
Algorithms chase momentum, extending trends. Carry trades borrow low-yield currencies to buy high-yield ones, like funding JPY for NZD longs.
Main point 1: Momentum ignition from news cascades into self-fulfilling trends.
Main point 2: Liquidity providers follow, deepening moves.
Main point 3: Mean reversion absent in imbalances, per efficient market tweaks.
This process repeats cyclically, letting trend followers profit passively.
What Are the Key Principles of Trend Following?
Key principles of trend following include trading with the trend as your guide, cutting losses quickly on breaks, and letting profitable trades run without interference. Let’s explore these rules that form the backbone.
How Do You Cut Losses Short in Trend Following?
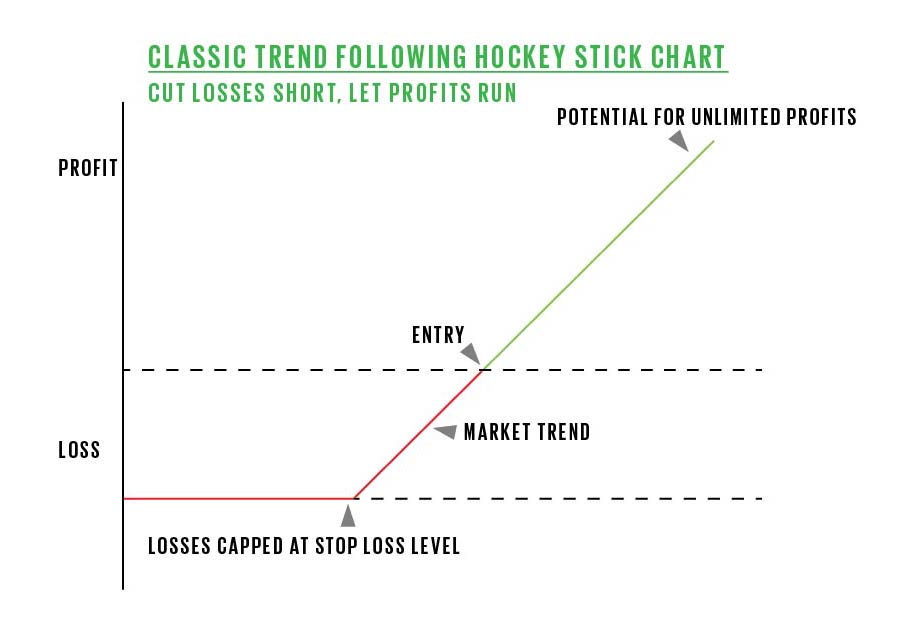
Cut losses short by using tight stop-losses placed beyond recent swing highs or lows, combined with position sizing limited to 1-2% account risk per trade. Specifically, for a long in GBP/USD, set stop below the latest swing low by 10-20 pips.
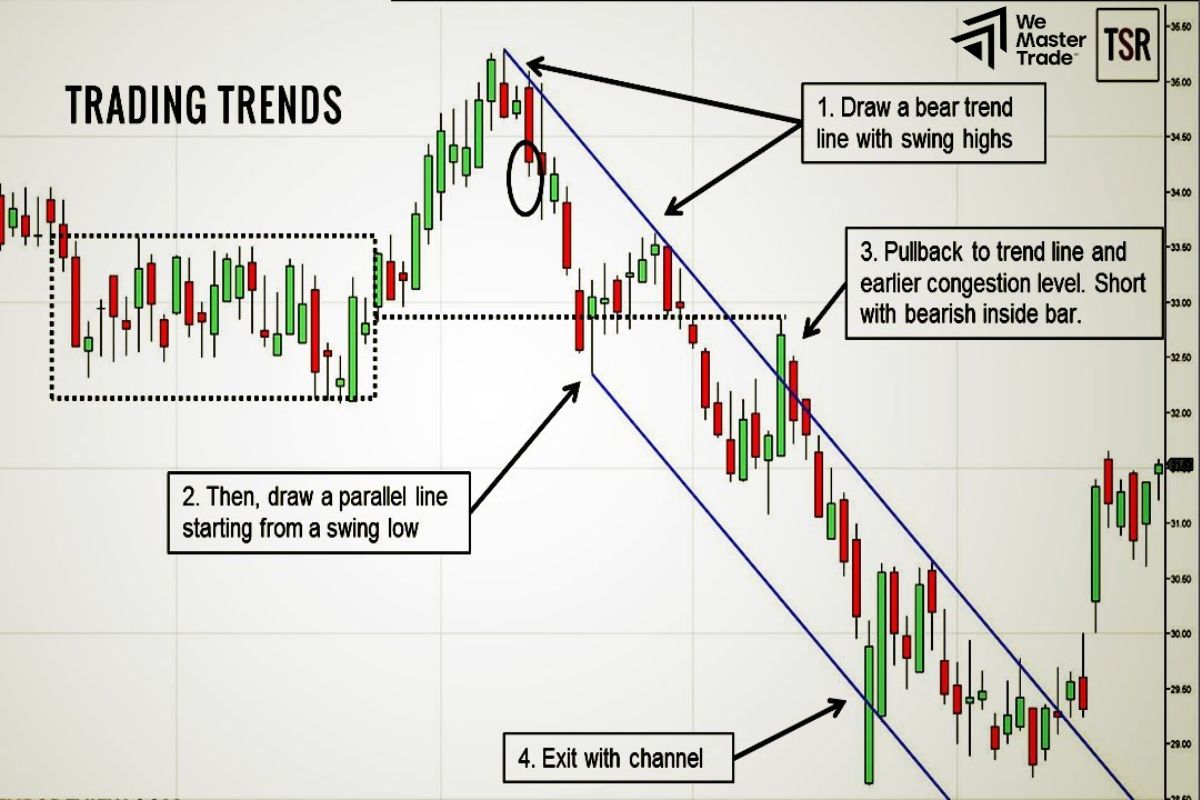
Position sizing scales with volatility. Use ATR: risk 1% on 2x ATR stop. If account is $10,000 and ATR 50 pips, max risk $100 means 0.1 lots.
Recent swings define stops dynamically. In uptrends, trail below swing lows.
For example, entering USD/CAD long at breakout, stop at prior low protects capital.
Main point 1: Psychological edge prevents hope, enforcing discipline.
Main point 2: Preserves capital for future setups.
Main point 3: Backtests show 40% win rate viable with 1:3 risk-reward.
Turtle rules used 2% risk, thriving in 1980s.
What Does “Let Profits Run” Mean in Practice?
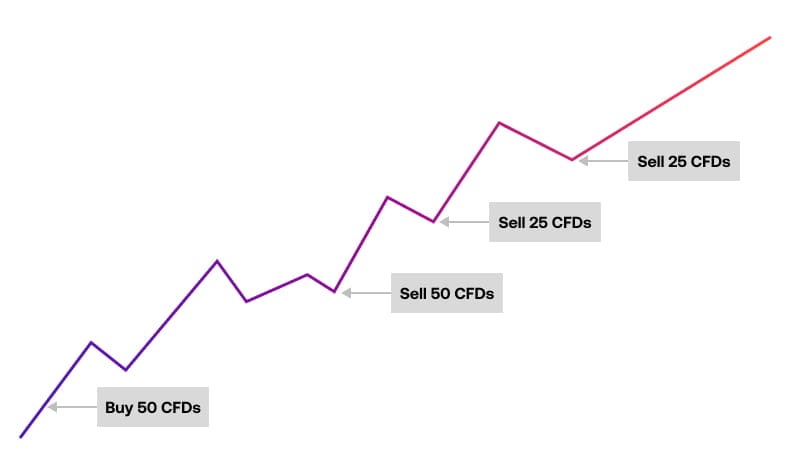
“Let profits run” means holding winning trades through pullbacks using trailing stops like Parabolic SAR or moving averages, avoiding fixed targets in strong trends. In Forex pairs like AUD/USD, trail stop to lock gains as price advances.
Practice involves no profit targets. Exit only on trend breaks, like MA crossover against.
Trailing methods: Chandelier exit (high minus ATR multiple) or SAR dots flipping.
For instance, in 2023 NZD/USD uptrend, trailing kept traders in for 1500 pips vs. early exit at 300.
Main point 1: Captures full trend extent, boosting expectancy.
Main point 2: Counters greed with rules.
Main point 3: Data shows winners average 3x losers in trends.
This principle compounds edges over time.
What Indicators Are Used for Trend Following in Forex?
Common indicators for trend following in Forex are moving averages for direction, ADX for strength, and Parabolic SAR for stops, filtering trades in pairs like EUR/GBP. To understand this better, group them by function.
How Do Moving Average Crossovers Signal Trends?
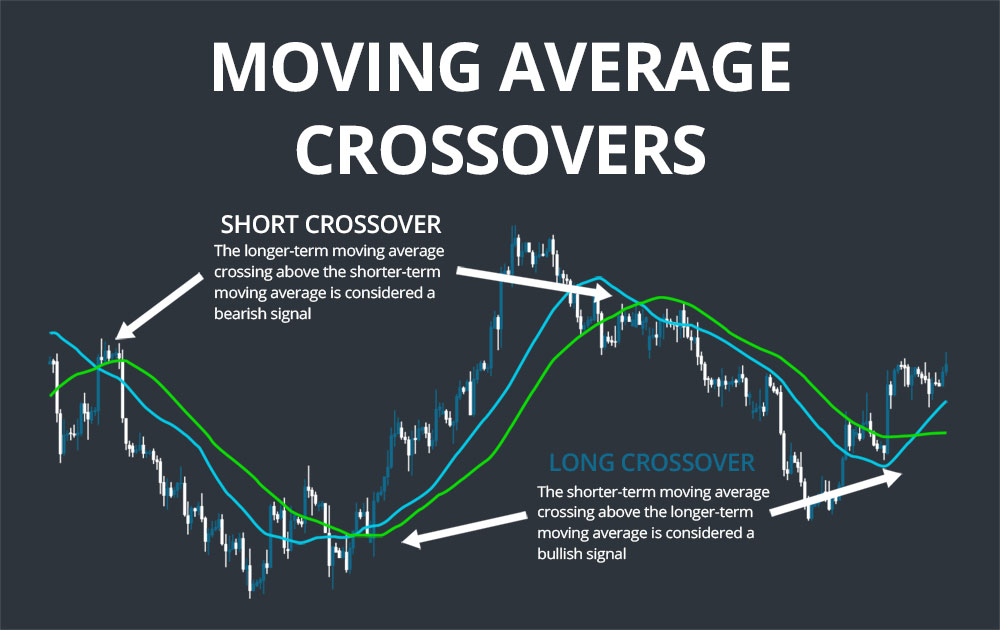
Moving average crossovers signal trends when a faster MA, like 20-period EMA, crosses above a slower 50-period EMA for longs, or below for shorts, in volatile Forex pairs. Specifically, golden cross (50/200 SMA) confirms majors.
Simple MAs smooth lags, exponentials weight recent prices. Dual setups reduce whipsaws.
In EUR/USD, 9/21 EMA cross on H4 enters pullbacks.
Main point 1: Filter with slope, upward for longs only.
Main point 2: Multi-MA ribbons show strength.
Main point 3: 60% accuracy in trends per TradingView studies.
What Role Does the ADX Play in Confirming Trend Strength?
ADX confirms trend strength above 25-30 levels, where +DI/-DI lines diverge, filtering weak Forex trends. Thresholds: under 20 range, 20-25 emerging, over 40 strong.
ADX rises in trends regardless of direction. Pair with DMI for bias.
In USD/JPY 2022, ADX hit 50 during surge.
Main point 1: Avoids ranging losses.
Main point 2: Declining ADX warns exits.
Main point 3: Backtests boost win rate 15%.
How Do You Enter and Exit Trades in a Trend Following Strategy?
Enter trend trades on pullback bounces or channel breakouts confirmed by indicators, exit via trailing stops or opposite signals to lock profits. Here’s the step-by-step for execution.
What Are Common Entry Signals for Trend Trades?
Common entry signals include pullback buys to EMAs in uptrends or breakout above resistance for major pairs like EUR/USD. Numbered steps: 1) Confirm trend on higher timeframe. 2) Wait for retrace. 3) Enter on candle close above EMA.
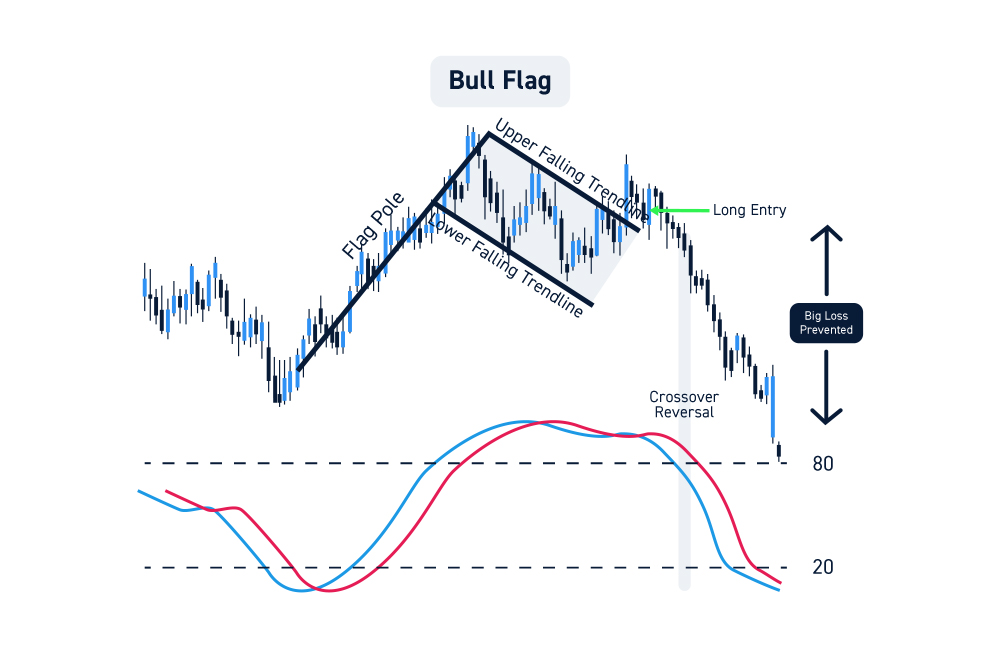
Breakouts use Donchian channels: buy 20-day high break.
In GBP/JPY, pullbacks to 50 EMA offer low-risk longs.
Main point 1: Reduces slippage in liquidity.
Main point 2: Aligns with institutional flows.
Main point 3: 1:2+ reward potential.
How Do You Manage Exits to Maximize Profits?
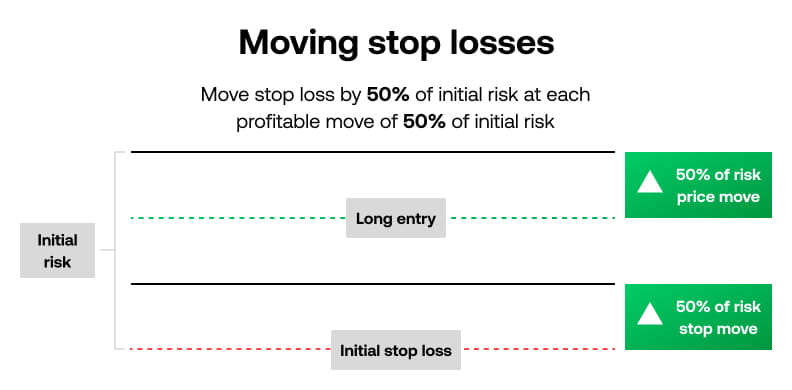
Manage exits with trailing stops like 2x ATR below highs, Parabolic SAR flips, or MA breaks in trending pairs. Steps: Set initial stop, trail daily, exit on signal.
Time-based if stagnant, but rare.
EUR/USD 2021 trend: SAR trailed for max gain.
Main point 1: Adapts to volatility.
Main point 2: Avoids reversal traps.
Main point 3: Increases profit factor to 1.5+.
What Are the Advantages and Disadvantages of Trend Following in Forex?
Trend following advantages include capturing large moves with low trade frequency and mechanical rules, while disadvantages involve whipsaws in ranges and long drawdowns. Let’s weigh them for realistic use.
Advantages shine in trending Forex eras. You profit from 30% trend time hugely, sitting out 70% ranges. Mechanical nature removes emotion, ideal for beginners. Leverage amplifies returns: 1% risk yields 3-5% monthly in good years.
Historical edges: Turtles averaged 30% annually. Forex liquidity enables scaling.
But ranging markets (70% time) trigger losses. 2020 EUR/USD chop cost many. Drawdowns hit 30-50%, testing psychology. Lags entries, missing starts.
Slippage in news hurts. Over-optimization fits past, not future.
Balanced view: Use with filters like ADX>25. Pairs well with mean reversion for all-weather portfolio.
Rhetorical question: Can you handle months without trades? If yes, it fits.
Performance data: Barclay CTA index shows 8-10% yearly, beating buy-hold in volatility.
Choose based on temperament: patient for trends, active for ranges.
Advanced Questions on Trend Following Strategies in Forex
Advanced trend following in Forex boosts results by tackling ranging markets, blending strategies, backtesting pitfalls, and psychological traps with precise adaptations.
Furthermore, these insights help traders refine approaches for consistent gains.
Is Trend Following Profitable in Ranging Forex Markets?
Trend following often underperforms in ranging Forex markets where prices move sideways without clear direction, leading to frequent false signals and whipsaws. Profitability improves significantly with adaptation techniques like filtering trend signals using oscillators. For example, pair a moving average crossover with the Relative Strength Index (RSI). Enter long only if the 50-period MA crosses above the 200-period MA and RSI exceeds 50, confirming momentum. In ranging conditions, the Average Directional Index (ADX) below 25 signals weak trends, so skip trades. Traders who apply these filters report win rates rising from 30% to over 50% in backtests on pairs like EUR/USD during low-volatility periods.
You’ll notice ranging markets dominate about 70% of the time in major Forex pairs. Oscillators like Stochastic help by identifying overbought or oversold levels within the range, avoiding premature entries.
To apply these filters in practice,
- Monitor ADX levels daily; stay out when below 25 to cut losses by 40%.
- Combine with Bollinger Bands; trade only breakouts from squeezes with oscillator confirmation.
- Review weekly charts for context, as intraday ranges mislead without higher timeframe trends.
What Is the Difference Between Trend Following and Breakout Trading?
Trend following and breakout trading both capitalize on momentum in Forex, but they differ in timing and sustainability. Trend following rides established moves using sustained indicators like moving averages, while breakout trading captures initial volatility from key levels. Breakout traders enter on price piercing support or resistance, often with high volume, aiming for quick profits as volatility expands. Trend followers wait for confirmation, such as multiple closes above a 20-day high, to join longer swings.
In practice, breakout strategies excel in volatile sessions like London open on GBP/JPY, but suffer from false breaks 60% of the time. Trend following provides smoother equity curves on pairs like AUD/USD during commodity-driven trends.
This distinction matters for risk profiles; breakouts demand tighter stops.
Key differences include,
- Entry triggers: Breakouts use one-bar closes beyond levels, trends require pullback retests.
- Holding periods: Breakouts last hours to days, trends span weeks.
- Success metrics: Breakouts win on high reward-to-risk (3:1), trends on higher win rates (45%).
How Do You Backtest a Trend Following Strategy for Forex Pairs?
Backtesting a trend following strategy for Forex pairs involves simulating trades on historical data to validate performance. Use platforms like MetaTrader 5 or TradingView with tick-level data from sources such as Dukascopy for accuracy spanning 15+ years. Start by coding rules, such as MACD crossovers with ADX filter, then run on major pairs like USD/JPY. Optimize parameters sparingly to avoid curve-fitting.

Common pitfalls include ignoring spreads and slippage, which erode 20-30% of edge in live trading. Employ walk-forward analysis: optimize on 2010-2015 data, test out-of-sample on 2016-2020.
Traders often overlook regime changes, like post-2008 low volatility.
For reliable results,
- Source quality data; free brokers provide bar data, but premium tick data reveals true drawdowns.
- Apply Monte Carlo simulations to stress-test 1,000 reruns for robustness.
- Track metrics beyond profit factor, like Sharpe ratio above 1.0 and max drawdown under 15%.
What Are Common Mistakes in Trend Following Forex Trading?
Common mistakes in trend following Forex trading stem from discipline lapses and misreading market states. Psychological biases like overtrading during choppy conditions cause 70% of account blowups. Traders chase weak signals, ignoring low ADX, leading to strings of losses on pairs like EUR/GBP in consolidation.
Another error is scaling out prematurely, missing trend extensions that deliver 80% of profits. Fixed position sizing without volatility adjustment amplifies drawdowns during news spikes.
Overtrading arises from FOMO after missing entries, fueling revenge trades.
To sidestep these traps,
- Enforce a “no-trade” rule when ADX <20, preserving capital for strong setups.
- Journal every trade with screenshots to spot patterns like weekend gaps ignored.
- Use trailing stops based on ATR, not arbitrary levels, to lock gains.
How Does Trend Following Compare to Mean Reversion Strategies?
Trend following and mean reversion strategies represent opposite Forex philosophies. Trend following profits from price continuation using momentum tools, while mean reversion bets on returns to averages like Bollinger Bands midlines. In trending markets, such as USD/CAD during oil rallies, trend strategies yield 2:1 reward-to-risk. Mean reversion shines in ranges, fading extremes on oscillators, but fails spectacularly in breakouts with 40% win rates.

Trend approaches have fewer but larger winners; mean reversion seeks frequent small gains.
Why does this matter for portfolio balance? Combining reduces volatility.
Core contrasts show,
- Market fit: Trends for directional volatility, reversion for sideways chop.
- Indicators: Trends use MAs and Parabolic SAR, reversion employs RSI divergences.
- Drawdowns: Trends experience long pauses, reversion hits strings of losers.
Can Trend Following Be Combined with Other Forex Strategies?
Trend following pairs effectively with other Forex strategies in hybrids that filter noise. Hybrids like trend plus scalping or news trading enhance edge by using trends as directional bias. For scalping, apply a 200-period EMA filter on 5-minute charts for EUR/USD; scalp pullbacks only in the trend direction, boosting win rates to 65%. News trading benefits from trend context: post-NFP, join breakouts aligned with daily trends.

These combos address trend strategy’s low trade frequency.
Scalping hybrids suit active traders, while news versions fit event-driven styles.
Effective hybrids involve,
- Trend + mean reversion: Fade pullbacks to dynamic support in uptrends.
- Trend + breakout: Confirm breakouts with MA alignment for lower false signals.
- Trend + carry: Hold positive-swap pairs like AUD/JPY only in confirmed trends.
What Timeframes Are Best for Trend Following in Forex?
The best timeframes for trend following in Forex depend on trading style and noise tolerance. Daily and 4-hour charts suit swing and position trading by filtering intraday whipsaws, outperforming lower frames by 25% in risk-adjusted returns. On daily charts, strategies like Donchlian channels capture multi-week trends on GBP/USD with fewer signals but higher accuracy.
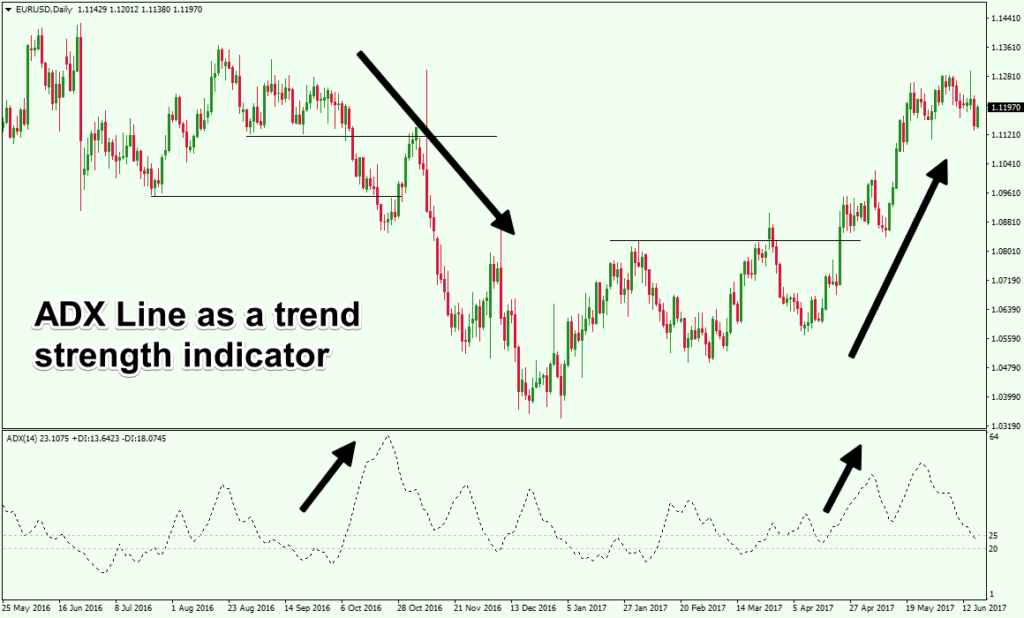
Intraday frames like 1-hour work for day traders but demand constant monitoring amid volatility.
Position traders prefer weekly for macro views.
Optimal choices align with,
- Swing trading: 4-hour for 2-5 day holds, ideal for busy schedules.
- Position trading: Daily or weekly to ride quarterly trends with minimal intervention.
- Day trading: 15-minute with higher timeframe confirmation to avoid traps.