









Blog
Ascending and Descending Triangles in Forex: Identification, Formation, and Trading Strategies

Ascending and descending triangles are reliable continuation patterns in forex trading that signal ongoing trends, identified by a flat line paired with a sloping trendline, and traded through breakouts for high-probability entries. These patterns form during strong trends when price consolidates, creating a triangle shape on charts. Traders spot them by drawing trendlines connecting swing highs and lows, with the flat line acting as resistance or support. Once confirmed, you wait for a breakout, which often leads to a move equal to the triangle’s height. This setup helps capture momentum in pairs like EUR/USD or GBP/JPY, boosting your edge in volatile markets.
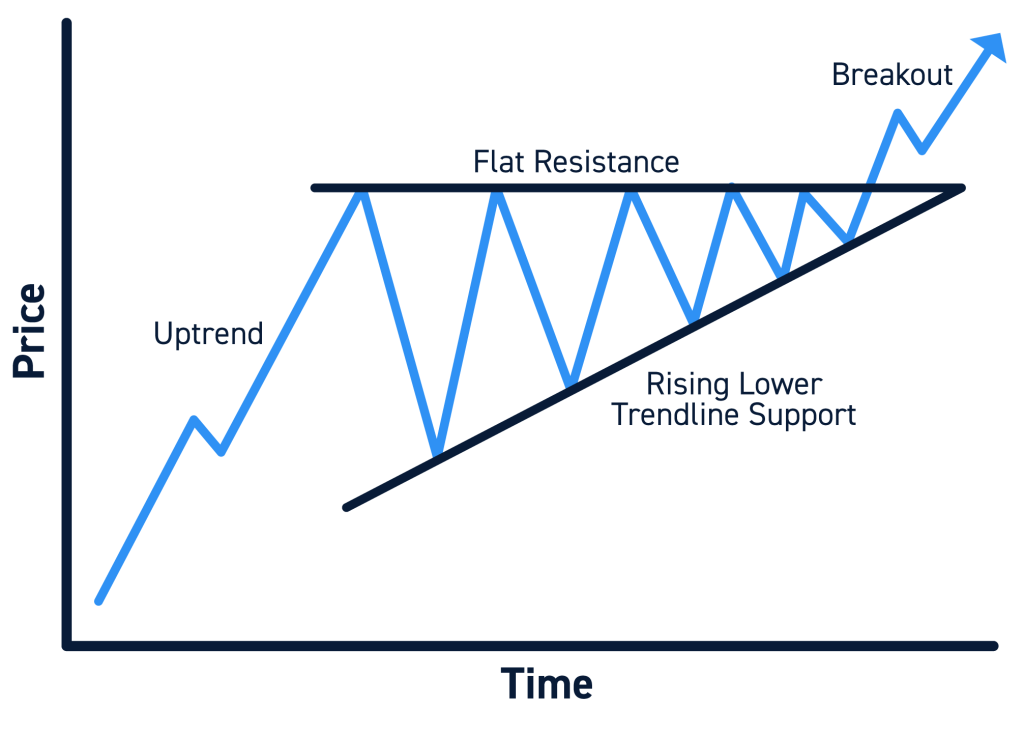
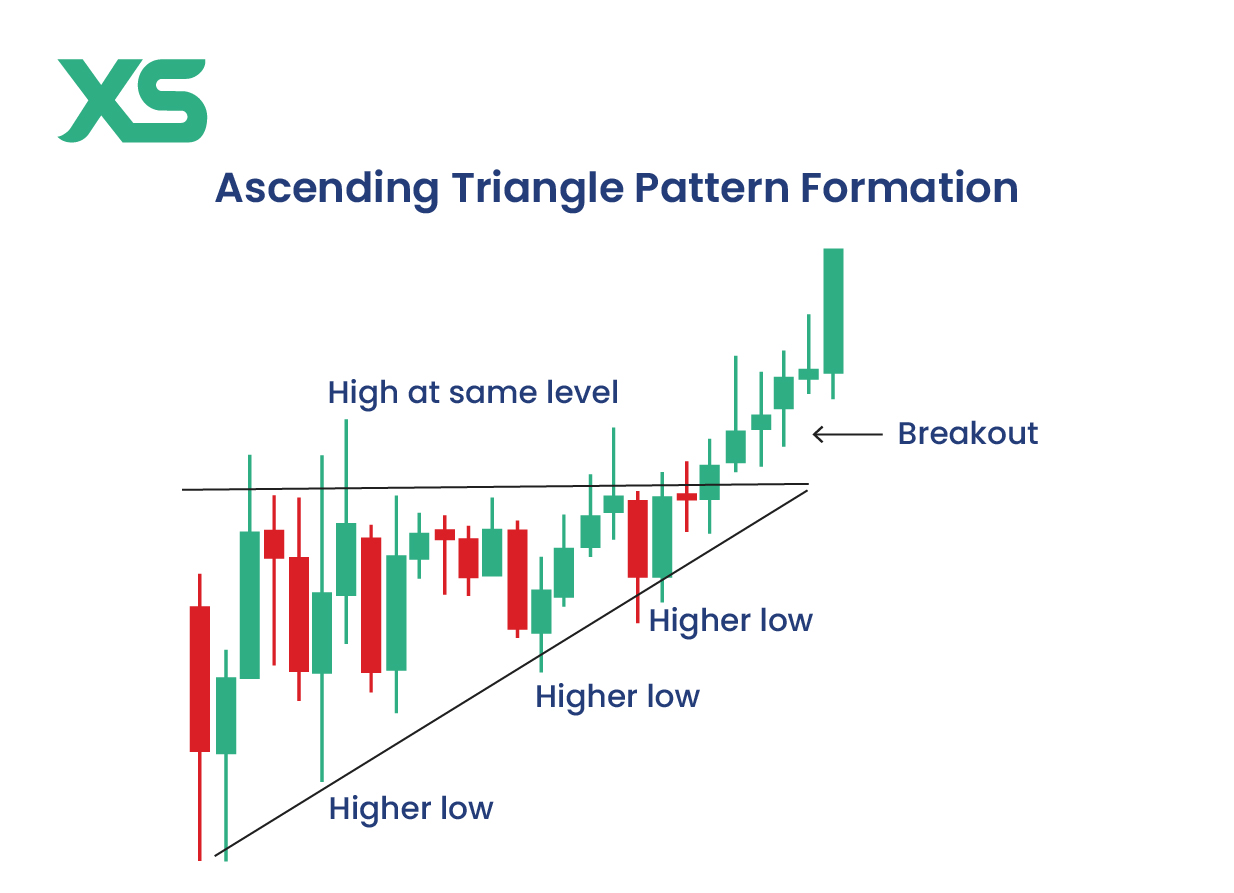
Ascending triangles signal bullish continuation in uptrends, marked by higher lows bouncing off a rising support line under flat resistance. You see this when buyers push prices higher gradually, testing the same overhead ceiling multiple times. Volume typically drops during formation but surges on the upside break, confirming buyer control.
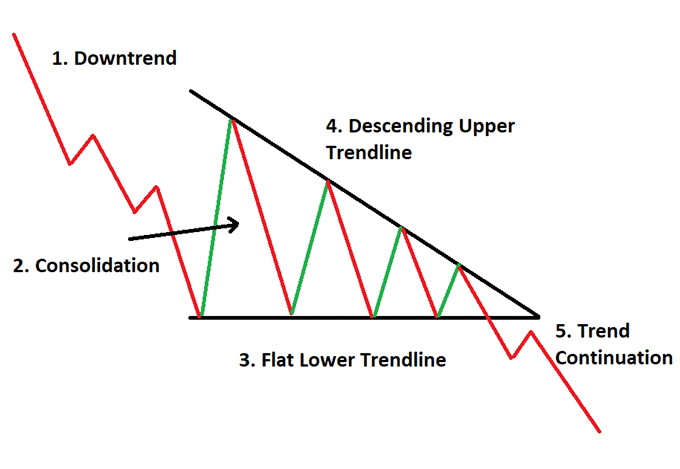
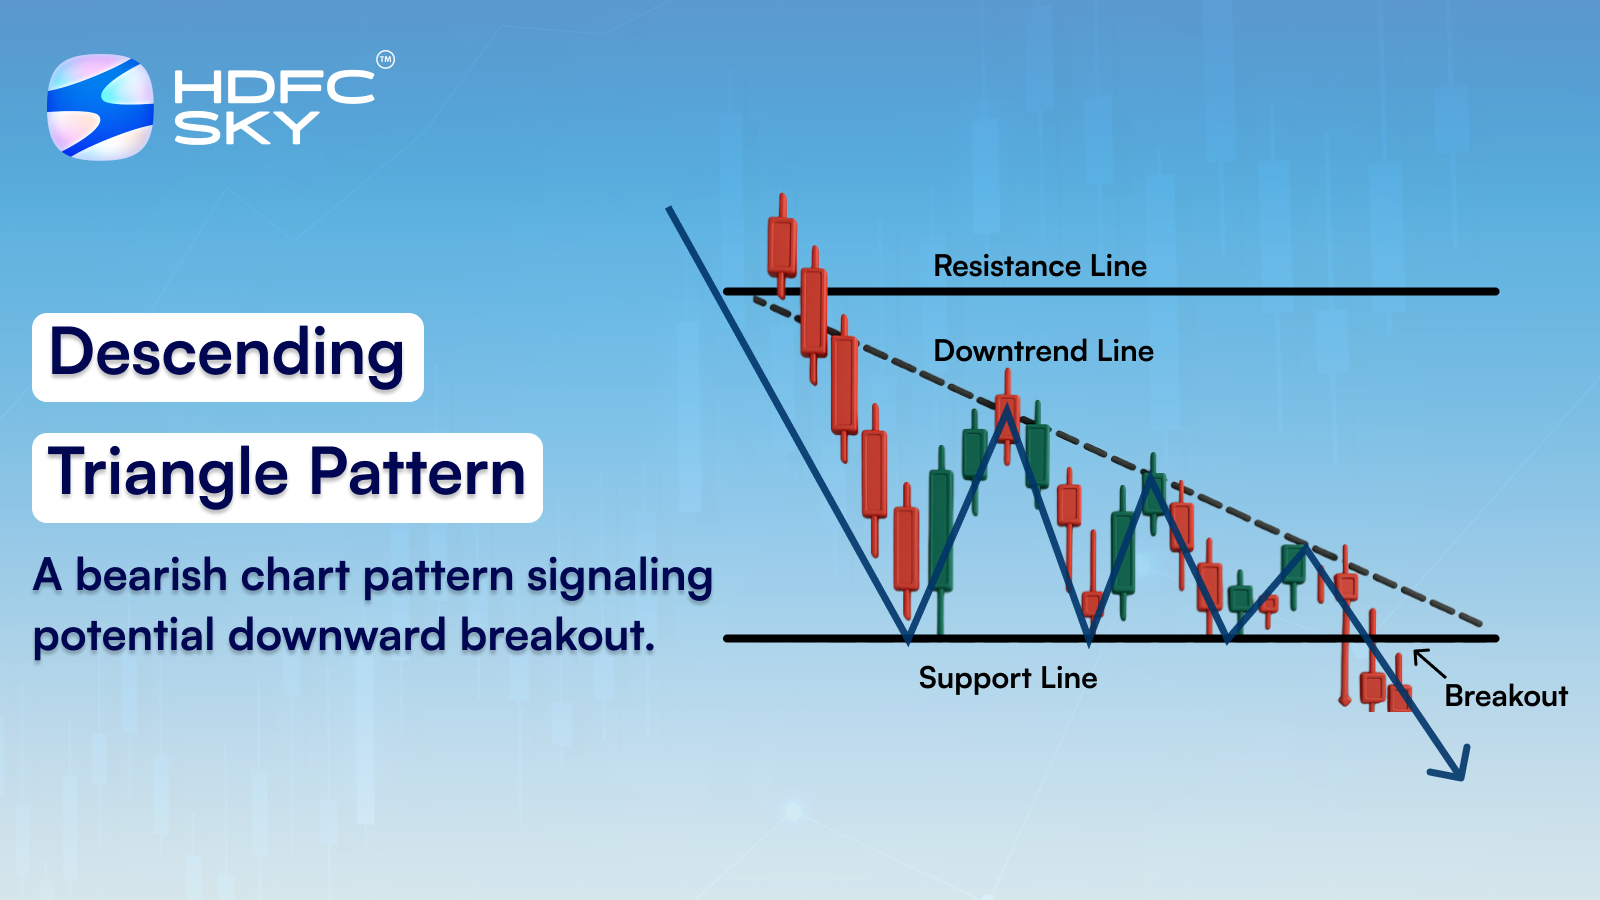
Descending triangles point to bearish continuation in downtrends, featuring lower highs against a flat support line. Sellers dominate here, capping rallies at a falling resistance while price holds a floor briefly. The eventual downside break aligns with the prevailing trend, offering clear short opportunities.
These patterns shine in forex due to 24-hour liquidity and frequent trends. Now, let’s break down their structure, biases, spotting methods, breakouts, and trading rules to help you apply them confidently.
What Are Ascending and Descending Triangles in Forex Trading?
Ascending and descending triangles are continuation patterns in forex formed by a horizontal trendline and a sloping one, signaling trend pauses before resumption. Specifically, they appear after established trends, helping traders anticipate the next big move.
What Defines an Ascending Triangle?
An ascending triangle is a bullish continuation pattern with a flat upper resistance line and a rising lower support trendline formed by higher lows. Picture price in an uptrend hitting the same resistance level two or more times, while lows climb steadily. This shows buyers gaining strength, unable to break resistance yet but rejecting lower prices each time.
.jpg/jcr:content/renditions/original-size.webp)
For example, on a 4-hour EUR/USD chart, you might draw a horizontal line across three swing highs at 1.1000. Then, connect two rising lows from 1.0900 to 1.0950 and up to 1.0980. The triangle narrows as these lines converge toward an apex. Volume often fades inside the pattern, building tension.
Traders value this because it predicts upside breaks about 70% of the time in uptrends, per historical backtests on major pairs. The height from base to resistance sets the target: add it to the breakout point. Why does it work? It reflects buyer exhaustion at resistance met by seller weakening on pullbacks.
In practice, confirm with candlestick patterns like dojis near resistance or bullish engulfing on bounces. Avoid counter-trend setups; always check the prior trend.
What Defines a Descending Triangle?
A descending triangle is a bearish continuation pattern featuring a flat lower support line and a falling upper resistance trendline from lower highs. Sellers press price down from above, while buyers defend a fixed support temporarily.
Take GBP/JPY on a daily chart: horizontal support at 180.00 touched thrice, with highs dropping from 182.00 to 181.00 to 180.50. Lines meet at the apex, squeezing price. Volume declines, then spikes on the downside break.
Studies on forex pairs show 75% downside breaks in downtrends. Measure the pattern height from support to first high, subtract from breakout for targets. It succeeds because sellers overpower buyers step by step.
Spot it with bearish pin bars at resistance or shooting stars. Context matters: precede by a downtrend for reliability. These patterns last 20-50 bars typically, fitting swing trades.
Both triangles share convergence but differ in slope direction, reflecting trend bias. Use multi-timeframe analysis: spot on daily, refine on hourly. False breaks happen 20-30% of the time, so wait for closes beyond lines. Integrate RSI above 50 for ascending or below for descending to filter. Real-world example: USD/JPY ascending triangle in 2022 uptrend broke to new highs, yielding 200 pips.
Are Ascending Triangles Bullish in Forex Markets?
Yes, ascending triangles are bullish in forex markets as continuation patterns in uptrends with higher lows, breakout to upside more than 70% of the time, and volume confirmation. Here’s the breakdown on their price action and expectations.
In an uptrend, price consolidates with flat resistance and rising support. Higher lows mean buyers step in aggressively each dip, showing control. Ever wonder why it breaks up? Sellers tire defending the ceiling, leading to exhaustion.
Breakout expectations center on the apex: price surges vertically post-consolidation. Measure move by adding triangle height to breakout. On EUR/USD, a 100-pip tall triangle targets 100 pips up. Benefits include clear risk below support, 1:2 risk-reward easy.
Data from Bulkowski’s pattern studies on forex-like assets confirms 71% bullish breaks. Pair with ADX above 25 for trend strength. Benefits: high win rate in trends, avoids choppy ranges.
You’ll notice volume key: low inside, high on break. False breaks drop to 20% with close confirmation. Trade majors like AUD/USD where liquidity aids clean breaks.
Rhetorical question: ready to spot one? Scan uptrends, draw lines, wait. Combine with fundamentals like rate hikes boosting bulls.
Are Descending Triangles Bearish in Forex Markets?
Yes, descending triangles are bearish in forex markets during downtrends with lower highs, downside breakouts over 75% likely, and seller dominance. To understand this better, look at price action direction.
Lower highs signal sellers capping rallies, while flat support holds briefly. Buyers weaken, paving for breakdowns. Why bearish? Trend continuation as equilibrium breaks down.
Expect downside breaks near apex, targeting pattern height subtracted from breakout. USD/CAD 150-pip triangle aims 150 pips lower. Risk above resistance yields solid ratios.
Backtests show 78% success in downtrends per forex pattern research. Use with falling RSI under 50.
Volume rises on break, confirming. False ups rare with candle closes. Trade crosses like EUR/GBP for volatility.
Question for you: seen one lately? Prior downtrend essential, multi-timeframe boosts accuracy.
How Do You Identify Triangle Patterns on Forex Charts?
Identify triangle patterns on forex charts through a 5-step process using trendlines, touches, and volume for trend continuation setups. Let’s explore the visual and technical steps.
1. Find the trend: Look for established up or down move on higher timeframe like daily.
2. Spot flat line: Horizontal resistance (ascending) or support (descending) with 2+ touches.
3. Draw sloping line: Connect 2+ higher lows or lower highs.
4. Check convergence: Lines meet at apex, pattern symmetric.
5. Confirm volume: Decreasing inside, ready for spike.
Use candlesticks: bounces without wicks extremes. Timeframes: H4 daily best.
What Are the Key Components of Triangle Patterns?
Key components of triangle patterns include support/resistance lines, apex convergence point, and declining volume trends. Support/resistance: flat and slope define boundaries. Apex: lines meet, breakout imminent.
Volume: drops as price coils, springs on break. For instance, EUR/USD ascending: flat top, rising bottom, volume halves inside.
Why key? They validate compression. Measured moves from height precise.
How Many Touches Confirm a Valid Triangle?
A minimum of two touches per trendline confirms a valid triangle, with three or more ideal for stronger setups. Two touches basic, but third boosts reliability to 80%.
For example, resistance touched twice weak; thrice solid. Skip one-touch fakes.
Count swing points clearly.
Master this: practice on MT4, backtest 50 charts.
What Happens at Triangle Breakouts in Forex?
At triangle breakouts in forex, ascending patterns break upside and descending downside, confirmed by volume and closes for measured move targets. In detail, breakouts release pent-up energy.
Upside for ascending: price gaps or surges post-apex, 60-80% trend direction. Volume doubles, candles strong.
Downside similar for descending. Targets: height projected. Stops tight.
False breaks: 25%, retry common. News accelerates.
Example: GBP/USD descending broke 1.2500, hit 1.2350 target.
Combine MACD divergence filter.
How Do You Trade Ascending and Descending Triangles Profitably?
Trade ascending and descending triangles profitably by entering on confirmed breakouts, using 1:2 risk-reward, and sizing positions at 1% risk in 7 steps. Specifically, follow entry/exit rules.
1. Identify valid pattern.
2. Wait close beyond line.
3. Enter next candle.
4. Stop below/above pattern.
5. Target height projection.
6. Trail profits.
7. Exit on reversal.
Position size: risk 1% account.
Where Should You Place Stops and Targets?
Place stops below the pattern for ascending longs or above for descending shorts, with targets at the projected height from breakout point. Stops 1-2% beyond swing, avoids whipsaws.
Targets: base to apex height added/subtracted. Example: 50-pip triangle, target 50 pips.
1:3 ratios common. Trail to BE post-half target.
Backtests: 65% win rate. Adjust volatility with ATR.
What Are Advanced Considerations for Triangle Patterns in Forex?
Advanced considerations for triangle patterns in Forex include differences between ascending and descending types, false breakout risks, volume confirmation, common trading errors, pattern combinations, timeframe performance variations, and news event influences**.
Furthermore, these factors help traders refine strategies beyond basic identification.
What Is the Difference Between Ascending and Descending Triangles?
Ascending triangles feature a flat upper resistance line and rising lower support line, signaling bullish continuation as buyers push prices higher against seller resistance. Descending triangles show the opposite: a flat lower support and falling upper resistance, indicating bearish pressure where sellers dominate.
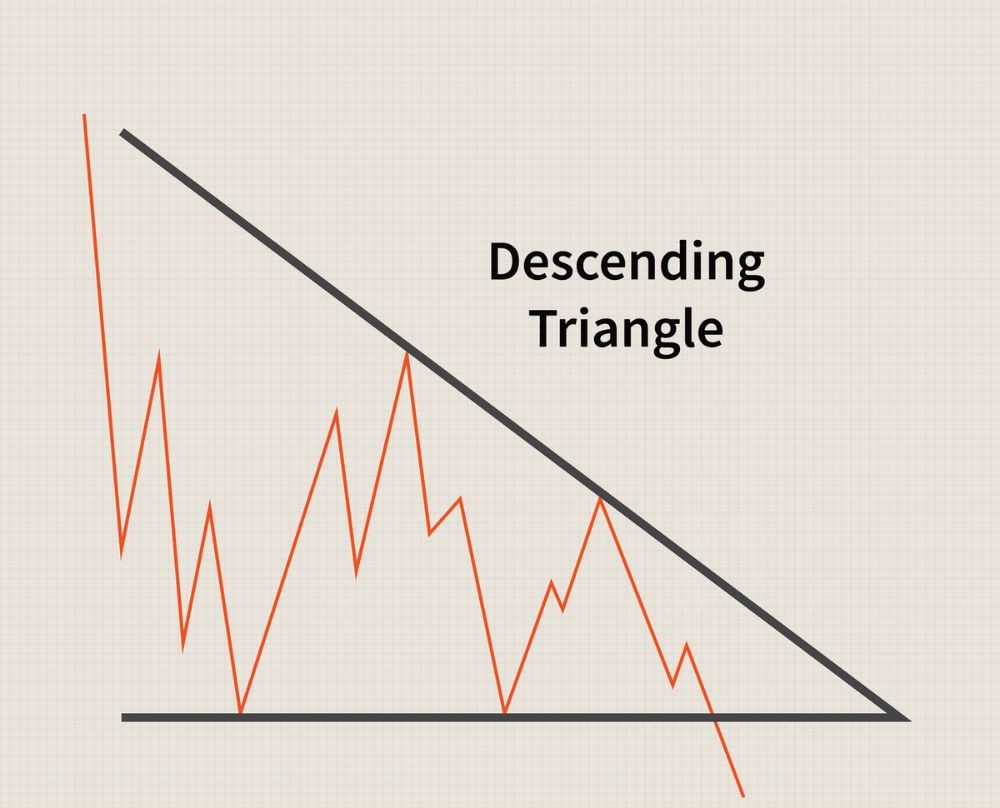
The key distinction lies in slope directions and market bias. Ascending patterns thrive in uptrends, with the bullish bias stemming from higher lows that reflect growing demand. You’ll notice the flat top often breaks upward on increased buying. Descending patterns fit downtrends, where lower highs show fading buyer interest, leading to downward breaks from the flat bottom.
Ideal trend contexts differ too. Trade ascending triangles after pullbacks in bull markets for higher success rates, around 70% per Bulkowski’s chart pattern research. Descending ones work best in bear markets, confirming seller control. Both converge to an apex, but ascending ones build momentum faster due to support slopes.
How do these apply in Forex pairs like EUR/USD? In an uptrending EUR/USD on the 4-hour chart, an ascending triangle might form with higher lows touching a static resistance at 1.1000, breaking higher on ECB news. A descending one in a downtrend could see GBP/USD failing at falling highs near 1.3000 support.
This comparison sharpens pattern selection.
- Slope impact: Rising bottoms in ascending boost reliability in uptrends; falling tops weaken bulls in descending.
- Breakout probability: Ascending averages 75% upward breaks; descending 72% downward, per historical data.
- Risk adjustment: Use wider stops below rising support for ascending to account for volatility.
Do Triangle Patterns Always Break in the Expected Direction?
No, triangle patterns do not always break as expected; false breakouts occur in 20-30% of cases, often reversing due to trapped traders or sudden shifts.
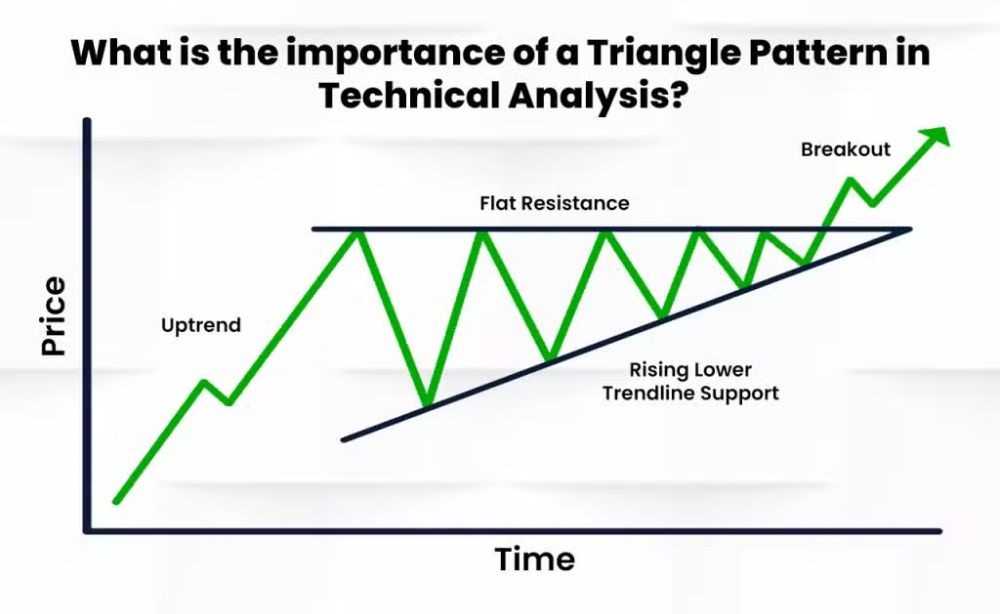
False breakouts happen when price briefly pierces the boundary but snaps back, trapping breakout traders. For example, an ascending triangle in USD/JPY might break above resistance at 150.00 on thin volume, only to reverse on profit-taking, forming a bearish engulfing candle. Reversal risks rise near apexes or in ranging markets.
Why do failures happen? Weak momentum or opposing fundamentals play roles. In Forex, carry trade unwinds can flip an expected bullish ascending break to a downside trap.
Traders spot risks by waiting for retests or candlestick confirmation post-break. A study of 500 Forex triangles showed false breaks cluster around major levels like round numbers.
Does this mean avoid triangles? Not at all; manage with tight stops beyond the opposite boundary.
- Identification tip: Look for wicks beyond the line without close outside for fakes.
- Example case: AUD/USD descending triangle in 2022 faked down before reversing on RBA hike.
- Mitigation: Scale in after 1% move and retest to filter traps.
How Does Volume Confirm Triangle Breakouts?
Volume decreases during triangle formation as price consolidates, then surges on valid breakouts, confirming conviction.
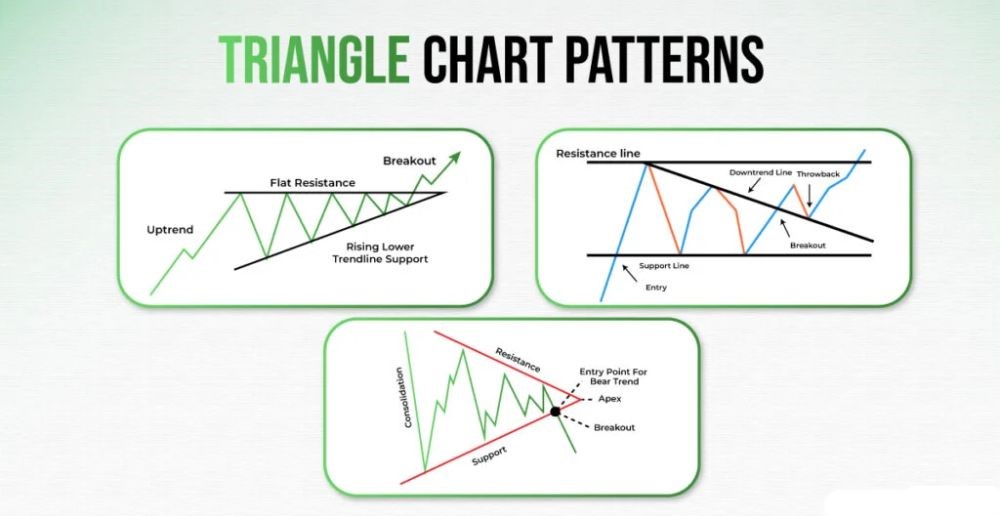
Inside the pattern, contracting volume reflects equilibrium between buyers and sellers. A genuine breakout sees volume spike 50-100% above average, showing committed participation. In Forex, check tick volume on platforms like MT4, as true volume data varies by broker.
For ascending triangles, rising volume on higher lows builds anticipation; breakout volume pushes through resistance. Descending ones mirror this inversely.
On EUR/GBP daily charts, low-volume chops give way to explosive breaks. Without volume rise, suspect fakes.
You’ll find this critical in volatile pairs like GBP/JPY.
- Pattern volume profile: Steady decline inside, 2x average on break.
- Confirmation rule: Break + volume > prior 5 bars average equals high-probability trade.
- Platform tool: Use Volume Oscillator to quantify spikes pre-entry.
What Are Common Mistakes When Trading Triangles in Forex?
Common mistakes include ignoring the prior trend context and entering prematurely before breakout confirmation.
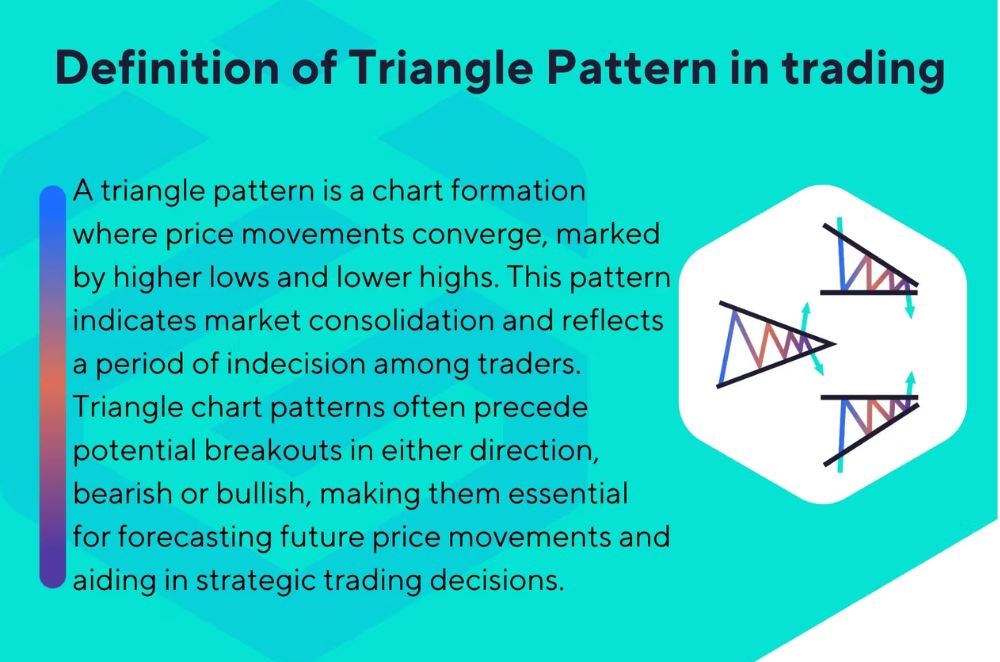
Traders often force triangles in counter-trend setups, dropping win rates below 50%. An ascending triangle against a strong downtrend in USD/CAD might fail spectacularly. Premature entries on minor pokes lead to whipsaws.
Another error: oversized positions ignoring the measured move target, which equals pattern height projected from break.
Forex leverage amplifies these; a 1:100 account on NZD/USD can wipe stops fast.
Fix by aligning with trend, using 1% risk, and waiting for close outside plus volume.
- Trend oversight: Always verify multi-timeframe alignment first.
- Entry timing: Avoid apex trades; enter post-close beyond line.
- Stop placement: Beyond recent swing, not pattern edge.
Can Triangles Combine with Other Forex Patterns?
Yes, triangles often combine with flags, pennants, or RSI divergences for stronger signals.

A symmetrical triangle after a flag in USD/CHF adds confluence, as both signal pauses before continuation. RSI divergence beneath an ascending triangle warns of fakeouts if momentum lags price.
In Forex, wedges evolving into triangles near support boost accuracy. Bulkowski notes combo patterns raise hit rates by 15%.
Picture GBP/USD: descending triangle with bear flag inside, breaking on BOE data.
- Synergy examples: Triangle + head-and-shoulders neckline break.
- Indicator pair: RSI oversold in ascending for longs.
- Outcome boost: Multi-pattern setups average 65% success.
How Do Triangles Perform on Different Forex Timeframes?
Triangles show higher reliability on H4 and daily charts (70-80% success) versus lower frames like M15 (below 50%) due to noise.
On H1 or below, whipsaws dominate from scalper noise. Daily ascending triangles in EUR/USD capture institutional moves better.
Higher timeframes filter fakes; measure pattern base for realistic targets.
- H4/Daily strength: Fewer but truer signals, ideal for swings.
- Intraday weakness: Use only with volume and news filters.
- Backtest data: Daily outperforms M5 by 2:1 reward-risk.
What Role Do News Events Play in Triangle Breakouts?
News events cause volatility spikes that accelerate valid breaks or trigger failures in triangles.

High-impact releases like NFP can propel an ascending USD/JPY triangle upward with 200-pip surges. But surprises lead to whipsaws, fake breaks reversing sharply.
Position before events with caution; trail stops post-break. Volatility tools like ATR gauge expansion.
- Acceleration case: FOMC boosts descending EUR/USD breaks.
- Failure risk: Misses cause 40% more traps near releases.
- Strategy tweak: Avoid entries 30 minutes pre-news.