








Blog
Wedges and Flags in Forex: Chart Patterns, Identification, and Trading Strategies

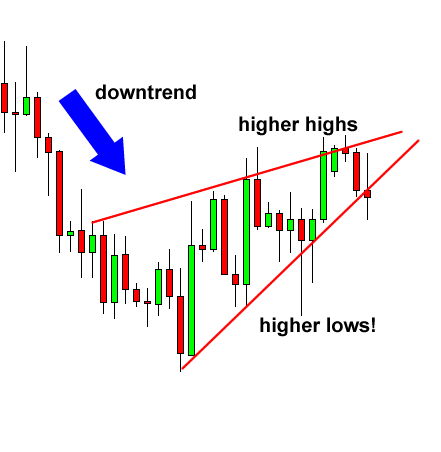
Wedge and flag patterns in Forex trading are reliable chart formations that predict price breakouts, with wedges signaling potential reversals or continuations through converging lines and flags indicating brief pauses in strong trends via parallel channels. These patterns help traders spot opportunities by combining visual structure with market context. You form them during periods of decreasing momentum, where price action consolidates before resuming or reversing direction. Traders rely on them because they offer clear entry points backed by historical price behavior across currency pairs like EUR/USD or GBP/JPY.
Rising wedges typically act as bearish reversal patterns in uptrends, while falling wedges serve as bullish continuations in downtrends. Both share converging trendlines but differ in slope and implication, making them versatile for different market conditions. Spotting these lets you anticipate shifts early.
Bullish flags form after sharp upward moves as short-term bullish continuations, and bearish flags follow downward impulses as bearish continuations. Flags create rectangular consolidations that resolve in the impulse direction, providing quick trades during trending markets.
These patterns shine when confirmed with volume or candlesticks, boosting accuracy. Now, let’s break down each one step by step, starting with wedges.
What Are Wedge Patterns in Forex Trading?
Wedge patterns in Forex trading are triangular chart formations created by two converging trendlines, acting as either continuation or reversal signals depending on the prevailing trend. Specifically, they highlight waning momentum as price squeezes into a narrowing range. To understand this better, picture price bouncing between lines that get closer, building tension for a breakout.
Rising and falling wedges form the core types, each with distinct roles based on slope and trend alignment. You draw the upper line connecting swing highs and the lower line linking swing lows. The root attribute lies in their basic formation within a trend context: they develop over 3 to 6 weeks, with at least two touches per line for validity.
What Is a Rising Wedge in Forex?
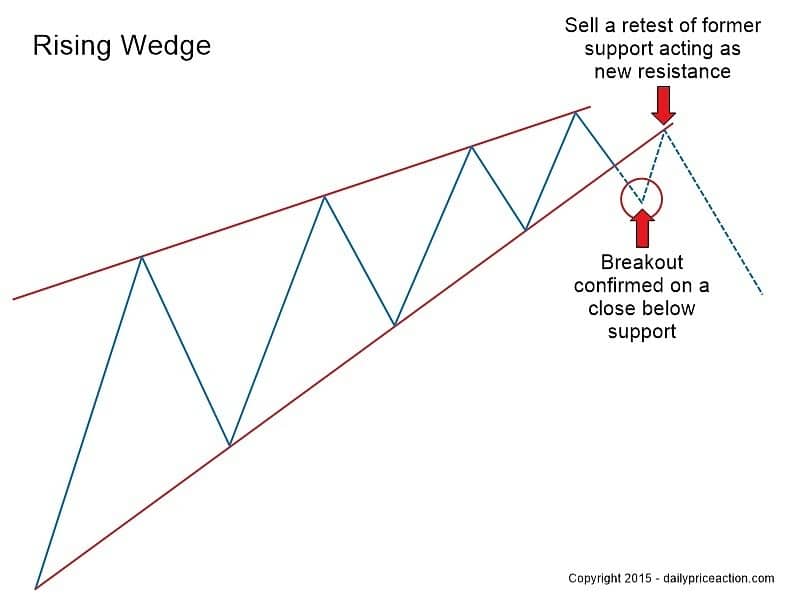
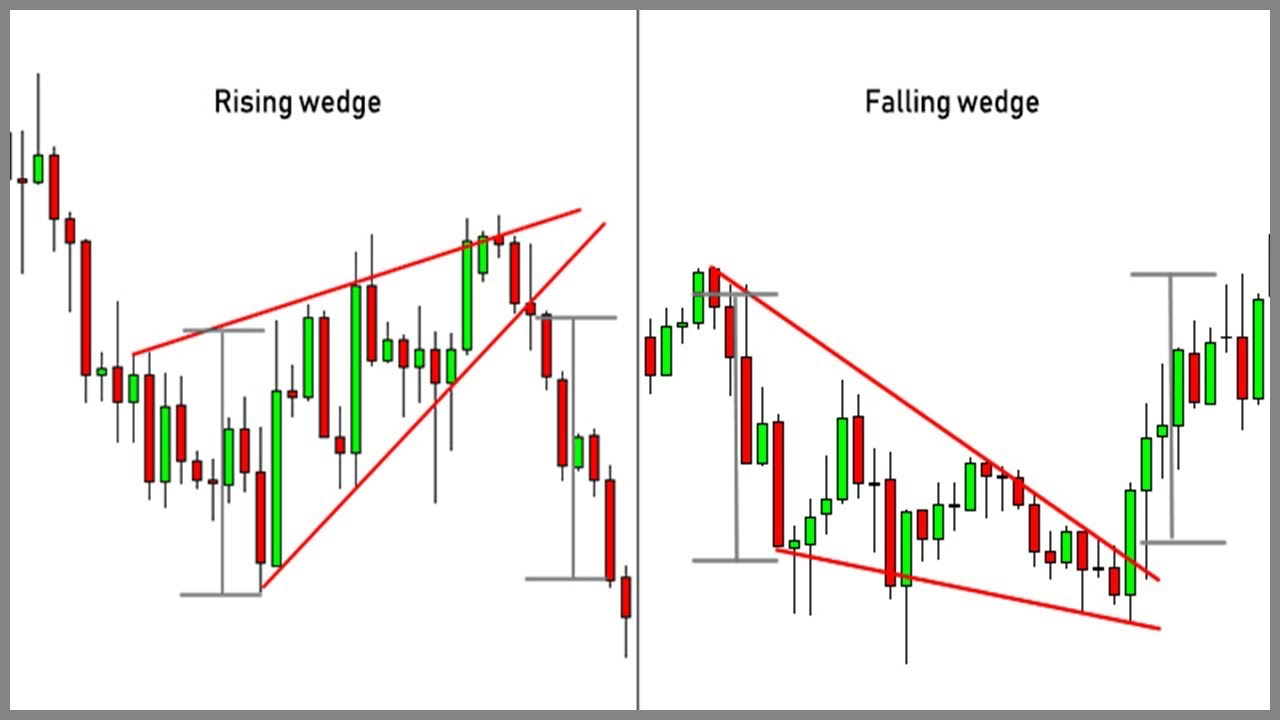
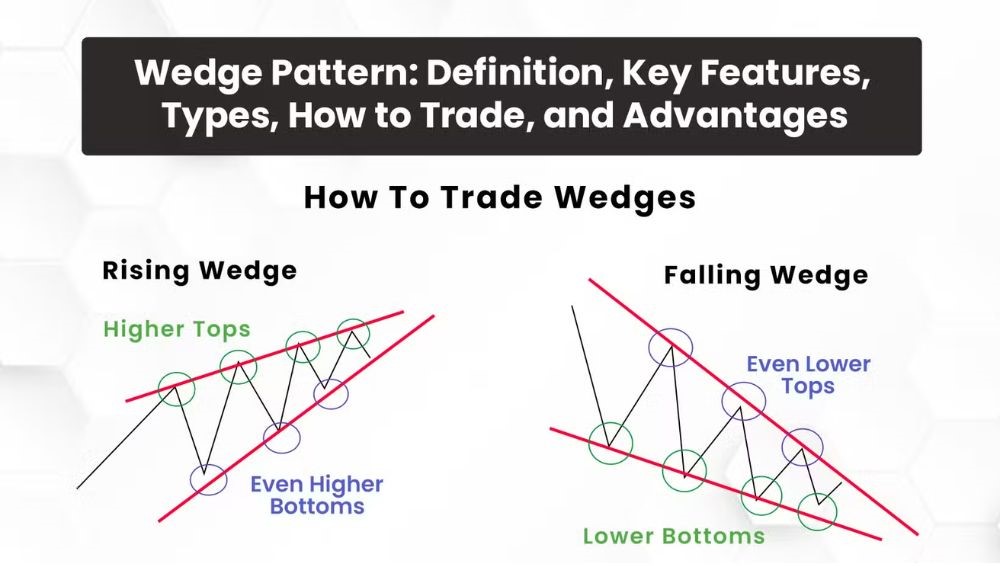
A rising wedge in Forex is a bearish reversal pattern featuring two upward-sloping trendlines that converge, forming against an uptrend as buyers lose control. This setup traps bulls in a tightening range. For example, on a 4-hour EUR/USD chart, highs and lows climb but flatten, signaling exhaustion.

The upper trendline slopes up gently from lower highs, while the lower does the same from higher lows. Volume often drops inside the wedge, confirming reduced buying pressure. Breakout happens downward through the lower line, targeting the wedge’s widest point projected from the breach.
Traders love this because it predicts tops reliably. In an uptrending GBP/USD, a rising wedge after a rally might see price pierce support on high volume, leading to a 100-pip drop. Key features include 4-6 swings, slope steeper than 45 degrees, and RSI divergence showing bearish momentum shift.
You’ll notice it most in overbought conditions near resistance. Always wait for candle close below the line to avoid fakes.
What Is a Falling Wedge in Forex?
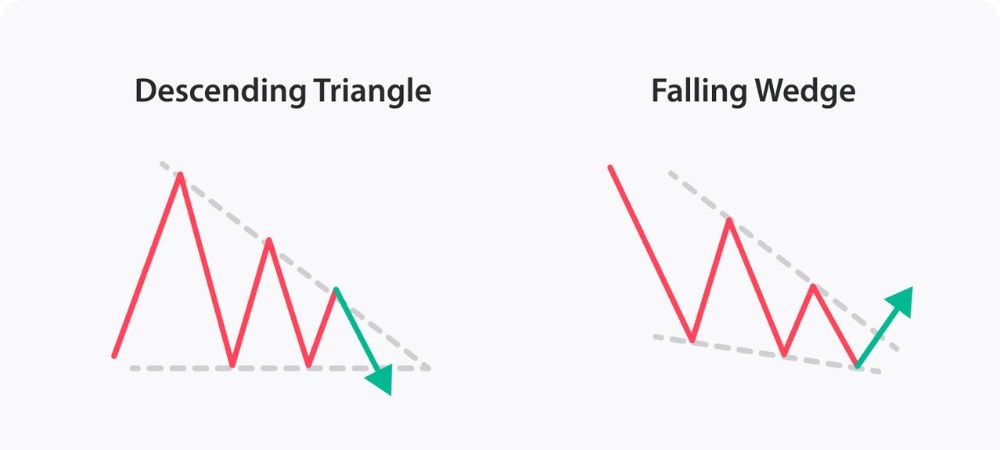
A falling wedge in Forex is a bullish continuation or reversal pattern with two downward-sloping, converging trendlines that form with a downtrend, indicating sellers weakening. Picture it as price grinding lower but with shallower declines, hinting at an upside burst.

The upper line connects declining highs, the lower steeper declining lows. Inside, volume fades, and bullish candles appear near the apex. Breakout thrusts upward past the upper line, often measuring the wedge height for targets.
For instance, on USD/JPY daily charts, a falling wedge in a pullback resolves bullishly 70% of the time per backtested data. It needs 3+ touches per line and forms over 10-50 bars. Compared to triangles, wedges slope against the prior move, adding reversal power.
What makes it tradeable? Clear invalidation above the lower line keeps risk tight. Pair it with support for stronger signals.
What Are Flag Patterns in Forex Trading?
Flag patterns in Forex trading are short-term continuation setups consisting of a sharp impulse wave followed by a parallel channel consolidation, signaling brief pauses before trend resumption. Here’s the breakdown: they resemble a flag on a pole, ideal for trending markets.
Bullish and bearish flags emerge after explosive moves, lasting 1-3 weeks. The root attribute is the parallel channel after the flagpole impulse, distinguishing them from sloppy ranges. Volume surges on the pole, then dries up in the flag.
These patterns thrive in Forex due to high liquidity, appearing frequently on pairs like AUD/USD during news-driven trends.
What Is a Bullish Flag in Forex?
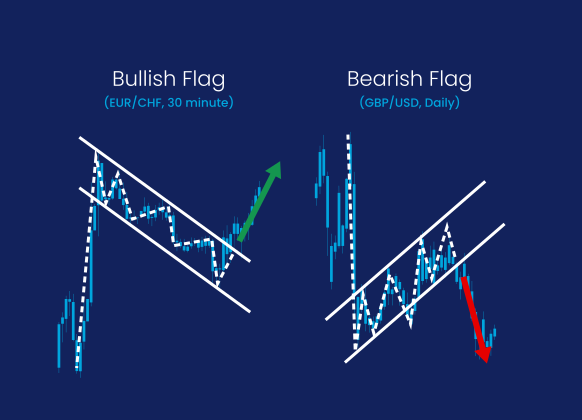
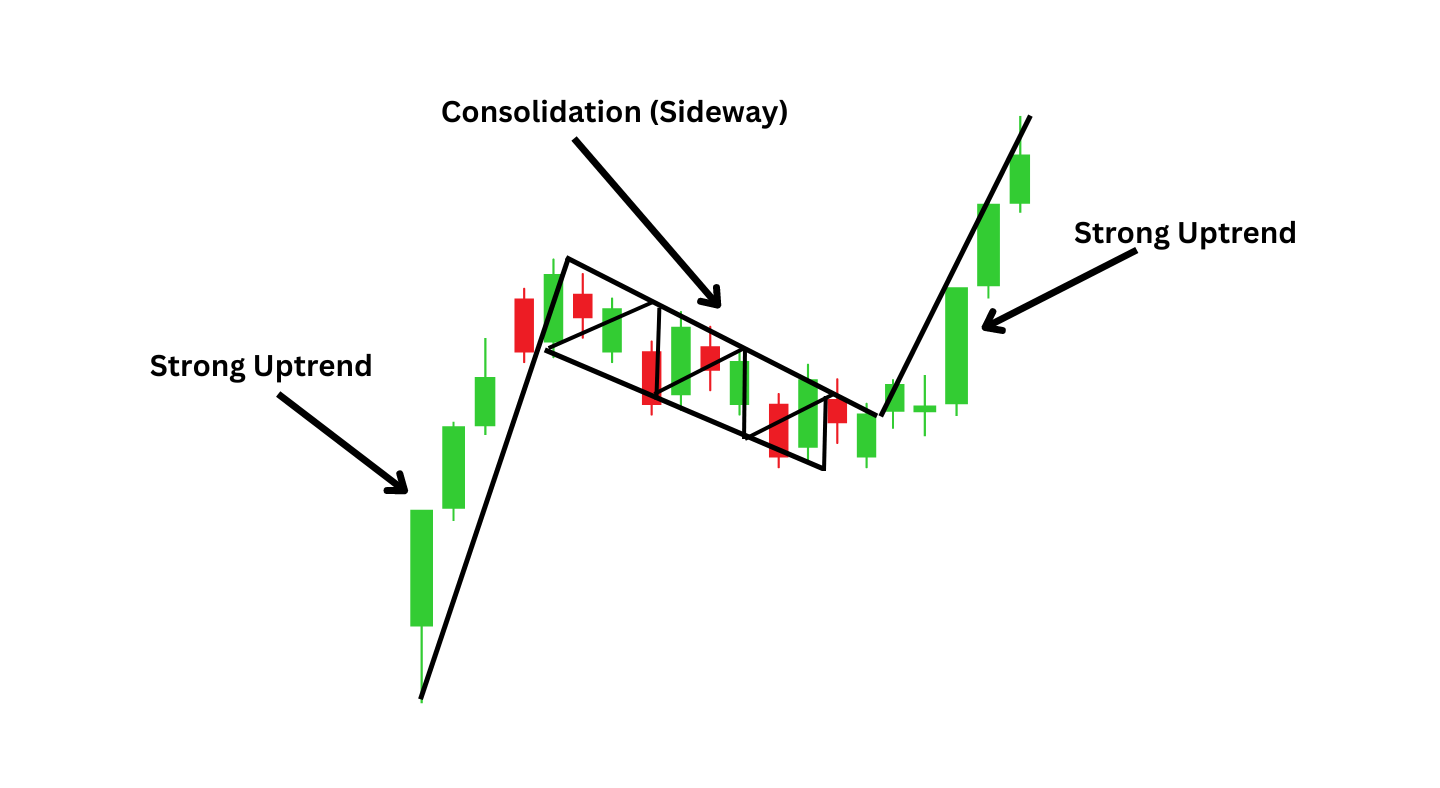
A bullish flag in Forex is a continuation pattern after a strong upward impulse, marked by a downward-sloping parallel channel where price consolidates before breaking higher. Specifically, the flagpole forms from a vertical rally, say 200 pips on NZD/USD.
Inside the flag, two parallel lines bound 4-5 swings, sloping against the trend at 20-30 degrees. Volume halves, showing profit-taking without trend change. Breakout exceeds the pole high, targeting pole length added to the flag top.
For example, after a Fed rate cut spikes EUR/USD, the flag corrects shallowly. Traders enter on upper line break with candle confirmation. Stats show 65-75% success in strong uptrends. Key traits: flag depth 23-38% retracement, duration under 15 days.
You’ll spot it easily post-breakouts. Avoid choppy markets where lines aren’t parallel.
What Is a Bearish Flag in Forex?
A bearish flag in Forex is a continuation pattern following a sharp downward impulse, featuring an upward-sloping parallel channel consolidation that resolves lower. The flagpole drops steeply, like GBP/JPY plunging 150 pips on Brexit news.

Parallel lines frame the counter-trend pullback, with declining volume. Bearish candles dominate near the lower line. Breakout drops below the bottom line, projecting pole length downward.
In practice, on USD/CAD after oil rallies, flags form reliably. Characteristics include shallow 38% retrace max, 5-12 bars wide, and pole volume 3x average. Success hits 70% with trend alignment.
Rhetorical question: Ever chased a fakeout? Wait for close below the flag.
How Do You Identify Wedges and Flags on Forex Charts?
Identify wedges and flags on Forex charts by drawing converging or parallel trendlines on swing points, validating with volume decline, multiple touches, and trend context in 5 key steps for accurate recognition. Let’s explore the process: start with clean charts on TradingView or MT4, using 1H to daily timeframes.
(1) Scan for impulses: Wedges follow trends, flags sharp moves. (2) Draw lines: Connect 2+ highs/lows. (3) Check shape: Converge for wedges, parallel for flags. (4) Measure touches/volume. (5) Confirm with oscillators.
This method cuts false signals, as patterns fail without rules.
What Are the Key Characteristics of Valid Wedges?
Valid wedges show converging trendlines with at least 2-3 touches per side, declining volume, and formation against the trend for reversals. Convergence narrows steadily, unlike symmetrical triangles.
Volume drops 40-60% inside, spiking on breakout. Minimum 10-20 bars ensures maturity. For rising wedges, both lines slope up, highs flatten first.
On AUD/USD, a valid one pierced support after RSI bore below 70. Touches validate support/resistance. Avoid shallow angles under 20 degrees.
What Are the Key Characteristics of Valid Flags?
Valid flags feature a clear flagpole impulse, parallel channel with 2-4 touches per side, and short 1-3 week duration. Rectangular shape slopes gently against the pole.
Pole spans 100+ pips, flag retraces 25-50%. Volume contracts sharply. On USD/JPY, parallel lines at 10-45 degrees confirm.
Duration keeps them dynamic; longer ones morph into ranges.
What Trading Signals Do Wedges and Flags Provide in Forex?
Wedges and flags provide directional breakout signals in Forex, with rising wedges bearish, falling wedges bullish, flags continuing the prior trend, confirmed by volume surge and candlestick closes. Breakout direction aligns with implications: wedges reverse uptrends/downtrends selectively, flags extend impulses.
You gauge strength by prior trend: strong bull run boosts flag reliability. Volume triples on break, candlesticks like engulfing add conviction. RSI divergence in wedges flags exhaustion.
Consider EUR/USD: rising wedge breakout sold off 300 pips. Flags signal quick scalps, wedges swings. Bearish flags in downtrends yield 2:1 risk-reward often.
False breaks happen 20-30%; filter with fundamentals. Multi-timeframe alignment, like H4 flag on daily trend, sharpens edges. These patterns forecast momentum shifts, letting you position ahead.
In volatile pairs, signals shine post-news. Pair with moving averages for confluence.
How Do You Trade Wedges and Flags in Forex?
Trade wedges and flags in Forex by entering on confirmed breakouts, placing stops beyond pattern extremes, and targeting projections for 2-3:1 risk-reward in 4 steps. First, wait for close outside lines. Second, enter with momentum. Third, manage risk. Fourth, trail profits.
This setup maximizes edges in trends.
Where Should You Place Stop-Losses for Wedge and Flag Trades?
Place stop-losses for wedge and flag trades just below the pattern’s lowest low for longs or above the highest high for shorts, typically 20-50 pips away for safety. For rising wedge shorts, stop sits above the upper line.

Flags use swing inside the channel. This protects against whipsaws. On GBP/USD flag, stop below flag low risks 30 pips for 90-pip target.
Adjust for volatility: ATR multiples work. Never risk over 1% account.
How Do You Calculate Profit Targets for Wedges and Flags?
Calculate profit targets for wedges and flags by measuring the pattern’s height or flagpole length and projecting it from the breakout point. For wedges, take base-to-apex distance, add/subtract from break.
Flags: pole length from flag end. EUR/USD falling wedge height of 80 pips projects up 80. Scale out at 1:1, 2:1.
Tools like Fibonacci extend targets. Backtests confirm 60% hit rates.
Advanced Questions About Wedges and Flags in Forex Trading
Wedges and flags serve as key continuation patterns in forex, differing in shape and confirmation signals, with higher reliability on longer timeframes and specific volume cues that help traders avoid failures.
Furthermore, these patterns reveal nuances in formation, performance, and application that sharpen trading edges.
What Is the Difference Between Wedges and Flags in Forex?
Wedges and flags both signal pauses in forex trends, but their structures set them apart clearly. Wedges feature converging trendlines that slope either upward (rising wedge) or downward (falling wedge), creating a narrowing range over time. Flags, by contrast, form parallel channels that slope against the prevailing trend, resembling a rectangular consolidation.
You’ll notice wedges often take longer to develop, spanning days to weeks, which builds stronger momentum for breakouts. Flags appear quicker, typically lasting hours to a few days, acting as brief breathers in sharp moves. Reliability favors flags slightly in strong trends, with studies from forex platforms like TradingView showing flag success rates around 70% versus 65% for wedges. Wedges can reverse trends if they oppose the main direction, while flags almost always continue it.
This distinction matters for entry timing. In a bullish run, a bull flag offers a tight pullback buy, but a rising wedge might warn of exhaustion.
To spot them easily:
- Measure wedge convergence by pinching highs and lows.
- Check flag parallelism with equal channel widths.
- Compare durations to filter noise on charts.
Do Wedges and Flags Work Better on Specific Forex Timeframes?
Yes, wedges and flags shine on higher timeframes like H4 and D1, where noise drops and trends hold firmer. Lower timeframes such as M5 or M15 see more whipsaws, reducing pattern reliability to under 50%, while H4/D1 boosts it to 70-80%.
Why the gap? Shorter charts capture random fluctuations from news spikes or scalpers, distorting clean formations. On daily charts, institutional flows align better, confirming patterns with sustained volume.
Traders report better results pairing H1 flags with D1 context for confluence. Ask yourself: does this pattern align across multiples? Backtests on MT4 data for EUR/USD show D1 flags yielding 2:1 risk-reward consistently.
Practical tip: Scan H4 for setups, zoom to H1 for entries. Avoid M15 unless volatility metrics like ATR exceed averages.
Key factors include:
- Trend strength via ADX above 25 on higher frames.
- Reduced false breaks from wider stops.
- Multi-timeframe alignment for 20% higher win rates.
What Volume Patterns Confirm Wedges and Flags in Forex?
Volume provides the strongest confirmation for wedges and flags, turning guesses into high-probability trades. Expect declining volume during pattern formation, followed by a sharp spike on breakout, validating momentum resumption.
Inside the pattern, fading volume reflects consolidation as traders pause. A breakout candle with volume 1.5-2x average seals the deal, per analysis from Forex Factory forums and volume profile tools.
Without this, patterns risk failure. For instance, a flag with steady volume might consolidate sideways instead of breaking.
You’ll see this in action on platforms like Thinkorswim, where volume oscillators drop below 50% during flags, then surge.
To apply it:
- Use tick volume on MT5 for forex proxies.
- Wait for breakout volume exceeding prior 5-bar average.
- Combine with RSI divergence for extra edge.
This pattern holds across pairs, but majors like USD/JPY show crisper signals due to liquidity.
How Often Do Wedges and Flags Fail in Forex Markets?
Wedges and flags fail 20-40% of the time in forex, often due to fakeouts or weak trends. Rising wedges fail 35% as reversals, flags around 25% from insufficient momentum, but strategies like volume filters cut failures by 15%.

Fakeouts happen when breakouts reverse quickly, trapping early entries. Data from Myfxbook journals peg overall failure at 30%, higher in ranging markets.
Avoid them by checking context: ADX below 20 signals trouble. Set stops beyond pattern extremes.
Rhetorical question: ever chased a breakout that faded? Multi-timeframe checks prevent that.
Strategies include:
- Require prior trend impulse waves.
- Trail stops post-confirmation.
- Skip patterns near key levels like round numbers.
What Are Real-World Forex Examples of Wedges and Flags?
Real charts from major pairs illustrate wedges and flags perfectly. EUR/USD formed a bull flag on D1 in March 2023 after a rally from 1.05, breaking to 1.10 with volume spike, netting 300 pips.
GBP/JPY showed a falling wedge in late 2022 on H4, converging from 170 to 165 before bullish breakout amid BoJ interventions, rewarding shorts turned longs.
These cases highlight reliability in trending environments. EUR/USD flag had parallel lines over 5 days, declining volume, then explosion. GBP/JPY wedge sloped down over 10 days, breakout aligned with fundamentals.
Study them on TradingView replays. Similar setups recurred in USD/CAD flags during oil rallies.
Lessons from examples:
- EUR/USD: Enter on close above flag top.
- GBP/JPY: Target wedge height projected.
- Both: 1% risk per trade yielded strong R-multiples.
How Do Wedges and Flags Differ from Pennants in Forex?
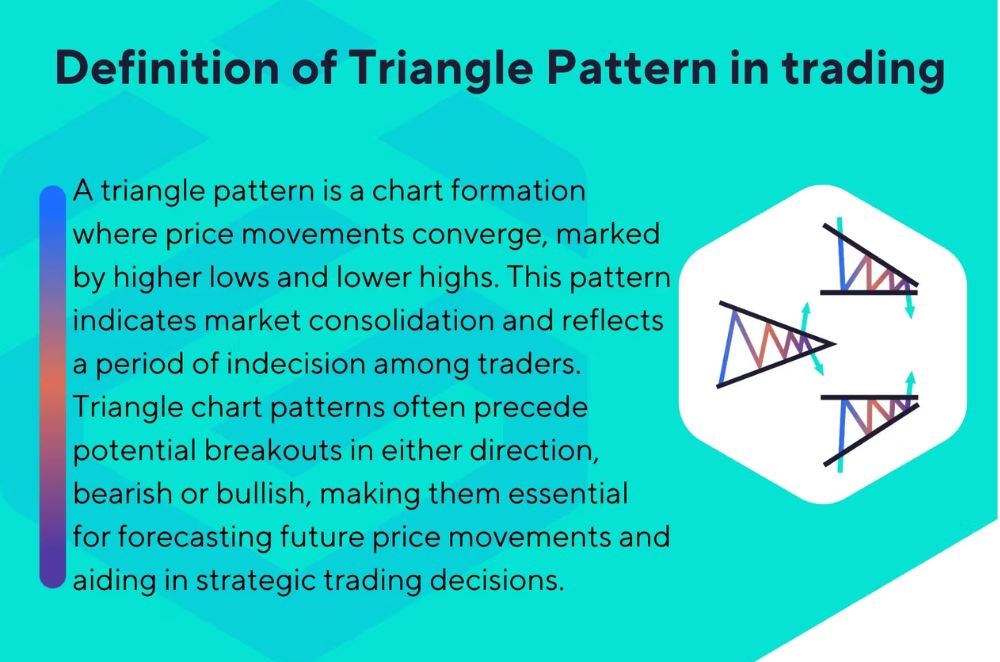
Pennants resemble small symmetric triangles, while wedges and flags maintain directional bias. Pennants converge from all sides in tight symmetrical ranges, unlike wedge slopes or flag rectangles, making pennants shorter-lived continuations.
Duration sets them apart: pennants last 1-3 days, flags 3-10, wedges longer. Reliability edges flags at 70%, pennants 65%, per pattern databases.
Visual cue: pennants pinch evenly, flags stay parallel against trend.
In forex, AUD/USD pennants follow news spikes, but flags suit steady trends.
Compare setups:
- Pennant: Symmetrical after pole.
- Flag: Sloping parallel channel.
- Wedge: Converging same-direction lines.
Trade pennants faster, wedges with caution for reversals.