









Blog
How to Use Technical Analysis in Forex Trading: A Complete Guide for All Levels

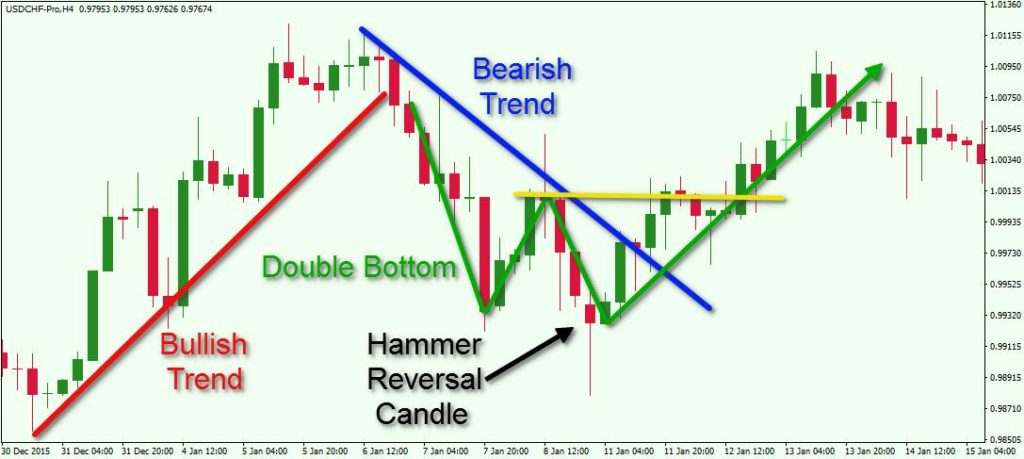
Have you ever wondered why some traders seem to predict market movements with uncanny accuracy while others struggle to make consistent profits? The answer often lies in technical analysis forex – a powerful approach that transforms price charts into actionable trading insights. Whether you’re just starting your trading journey or looking to refine your expertise, mastering technical analysis can be the game-changer you’ve been searching for.
What is Technical Analysis in Forex Trading?
Think of technical analysis as reading the market’s body language. Just as you can understand someone’s mood by observing their facial expressions and gestures, technical analysis helps you understand market sentiment by studying price movements and patterns. Unlike fundamental analysis, which focuses on economic indicators and news events, technical analysis believes that everything you need to know is already reflected in the price.
At its core, technical analysis operates on three fundamental principles that every trader should understand:
- Price discounts everything – All available information is already factored into current market prices
- Price moves in trends – Markets tend to move in recognizable patterns rather than randomly
- History tends to repeat itself – Human psychology remains consistent, creating recurring chart patterns
Essential Technical Analysis Tools Every Forex Trader Must Know
Let me share the tools that transformed my trading from guesswork to strategic decision-making. These aren’t just theoretical concepts – they’re practical instruments I use every single day in my trading.
1. Support and Resistance Levels
Support and resistance are like invisible barriers in the market. Support acts as a floor where buying pressure typically emerges, while resistance serves as a ceiling where selling pressure increases. Here’s how to identify them:
“The market has memory. Where price struggled before, it will likely struggle again.” – Professional traders’ wisdom
| Support Characteristics | Resistance Characteristics |
|---|---|
| Previous swing lows | Previous swing highs |
| Round psychological numbers (1.2000, 1.3000) | Round psychological numbers |
| Moving average levels | Fibonacci retracement levels |
| Trendline support | Trendline resistance |
2. Moving Averages – Your Trend-Following Compass
Moving averages smooth out price action to reveal the underlying trend. I personally use a combination of the 50-day and 200-day moving averages for my swing trading strategies. When the 50-day crosses above the 200-day (known as the “Golden Cross”), it often signals a strong bullish trend.
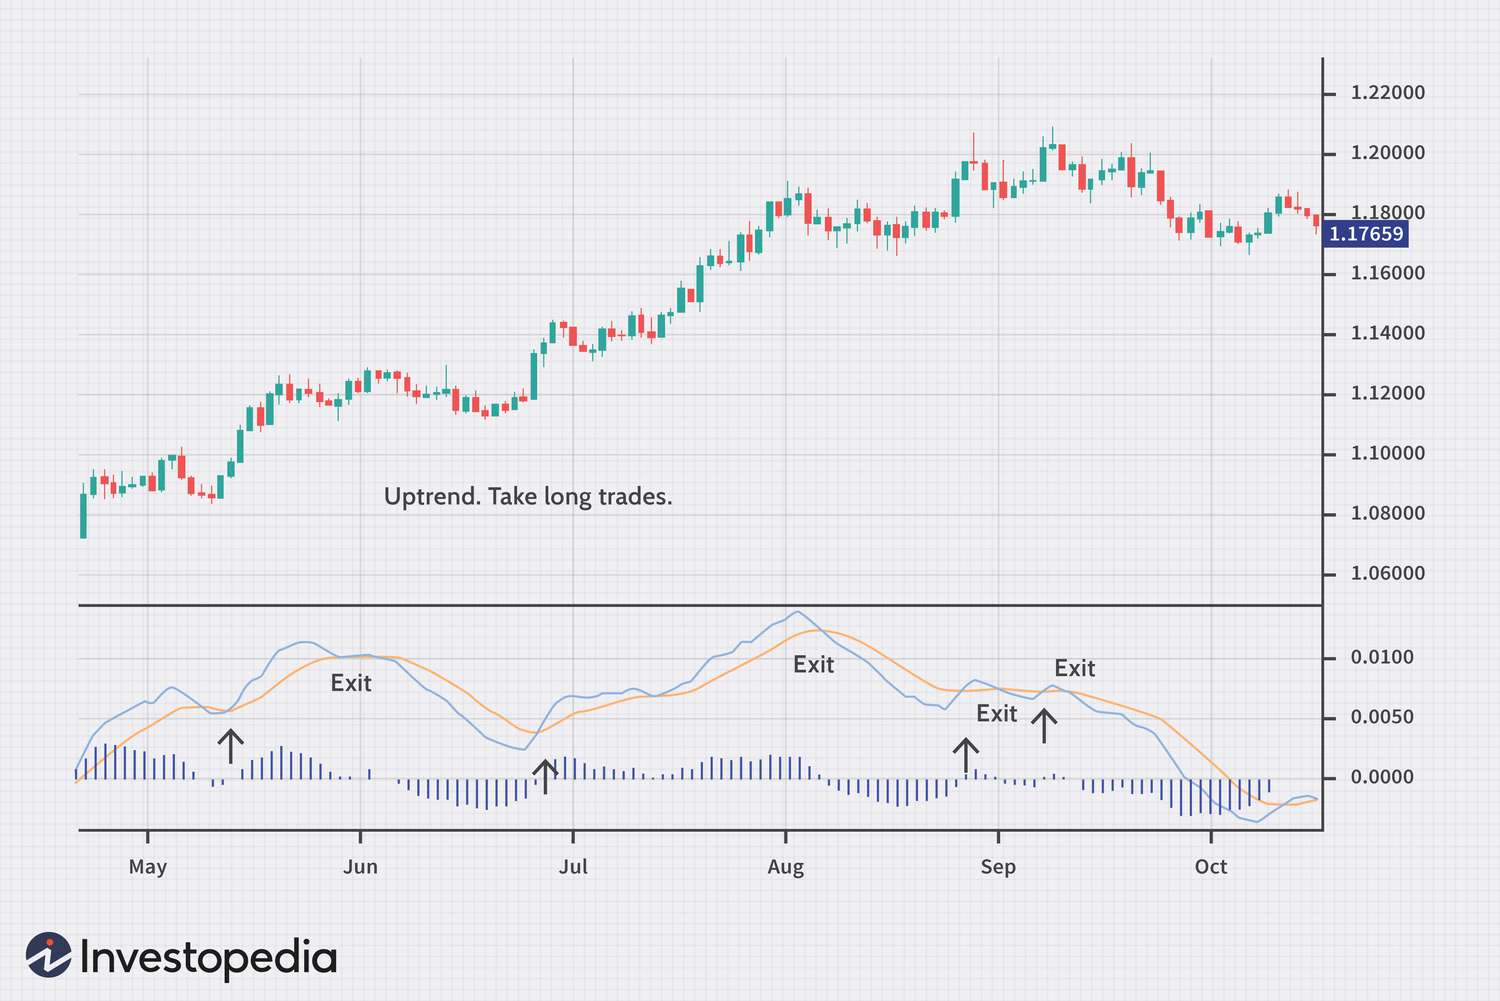
For day traders, shorter periods like the 9-day and 21-day moving averages provide more responsive signals. The key is finding the right balance between sensitivity and reliability for your trading style.
3. RSI (Relative Strength Index) – The Momentum Detector
The RSI indicator helps identify overbought and oversold conditions. Think of it as a speedometer for price momentum. When RSI rises above 70, the market might be overheating (overbought). When it drops below 30, selling pressure might be exhausted (oversold).
But here’s a pro tip many beginners miss: Don’t use RSI in isolation. Combine it with support and resistance levels for higher probability trades. For instance, if price reaches a strong resistance level while RSI shows overbought conditions, that’s a powerful sell signal.
Chart Patterns That Actually Work in Forex Trading
After analyzing thousands of charts over my trading career, I’ve found certain patterns consistently deliver results. Let’s explore the most reliable ones:
Head and Shoulders Pattern
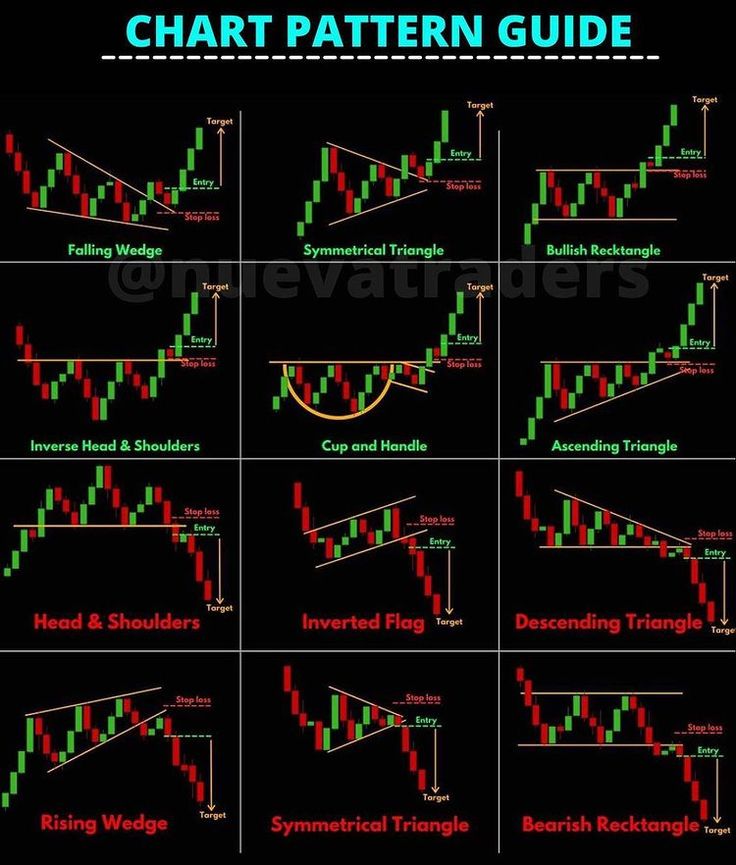
This reversal pattern resembles a person’s head and shoulders when viewed on a chart. It signals a potential trend change from bullish to bearish (or vice versa for inverse head and shoulders). The pattern consists of:
- Left shoulder – Initial peak
- Head – Higher peak
- Right shoulder – Lower peak similar to the left shoulder
- Neckline – Support level connecting the lows
The beauty of this pattern? It provides clear entry and exit points. Enter when price breaks below the neckline, with your stop loss above the right shoulder.
Double Top and Double Bottom
Double tops form when price hits the same resistance level twice and fails to break higher, signaling potential reversal. Conversely, double bottoms occur at support levels and often precede bullish moves. These patterns work exceptionally well on the daily timeframe for major currency pairs like EUR/USD and GBP/USD.
Building Your Technical Analysis Trading Strategy
Now that you understand the tools, let’s put them together into a coherent strategy. Here’s my personal approach that has served me well over the years:
Step 1: Identify the Trend
Start with the higher timeframes (daily or weekly) to determine the overall trend direction. Use moving averages and trendlines to confirm whether the market is trending up, down, or sideways. Remember: “The trend is your friend until it ends.”
Step 2: Find Entry Points
Once you’ve identified the trend, zoom into lower timeframes (4-hour or 1-hour) to find precise entry points. Look for:
- Pullbacks to moving averages in trending markets
- Breakouts from consolidation patterns
- Bounce trades from support/resistance levels
- Confluence of multiple technical indicators
Step 3: Manage Risk Like a Professional
This is where many traders fail. Proper risk management separates professionals from amateurs. Never risk more than 1-2% of your account on a single trade. Use this simple formula:
Position Size = (Account Balance × Risk %) / (Stop Loss in Pips × Pip Value)
Common Technical Analysis Mistakes to Avoid
Let me share some painful lessons I learned the hard way, so you don’t have to:
Mistake #1: Analysis Paralysis
Using too many indicators creates confusion. I’ve seen traders with charts so cluttered they can barely see the price! Stick to 2-3 complementary indicators maximum. Quality over quantity always wins.
Mistake #2: Ignoring Multiple Timeframes
What looks like a buying opportunity on the 5-minute chart might be a strong resistance level on the daily chart. Always check multiple timeframes before making trading decisions. I use the “Rule of Three” – analyze three different timeframes before entering any trade.
Mistake #3: Fighting the Market
Your analysis might be perfect, but if the market decides to go the other way, accept it and move on. The market is always right. As legendary trader Jesse Livermore said, “The market can remain irrational longer than you can remain solvent.”
Advanced Technical Analysis Techniques for Experienced Traders
For those ready to take their analysis to the next level, here are some sophisticated techniques I use:
Fibonacci Retracements and Extensions
Fibonacci levels provide incredibly accurate support and resistance levels based on mathematical ratios found throughout nature. The key retracement levels are 23.6%, 38.2%, 50%, and 61.8%. I’ve found the 61.8% level particularly reliable for entering trades in the direction of the main trend.
Market Structure Analysis
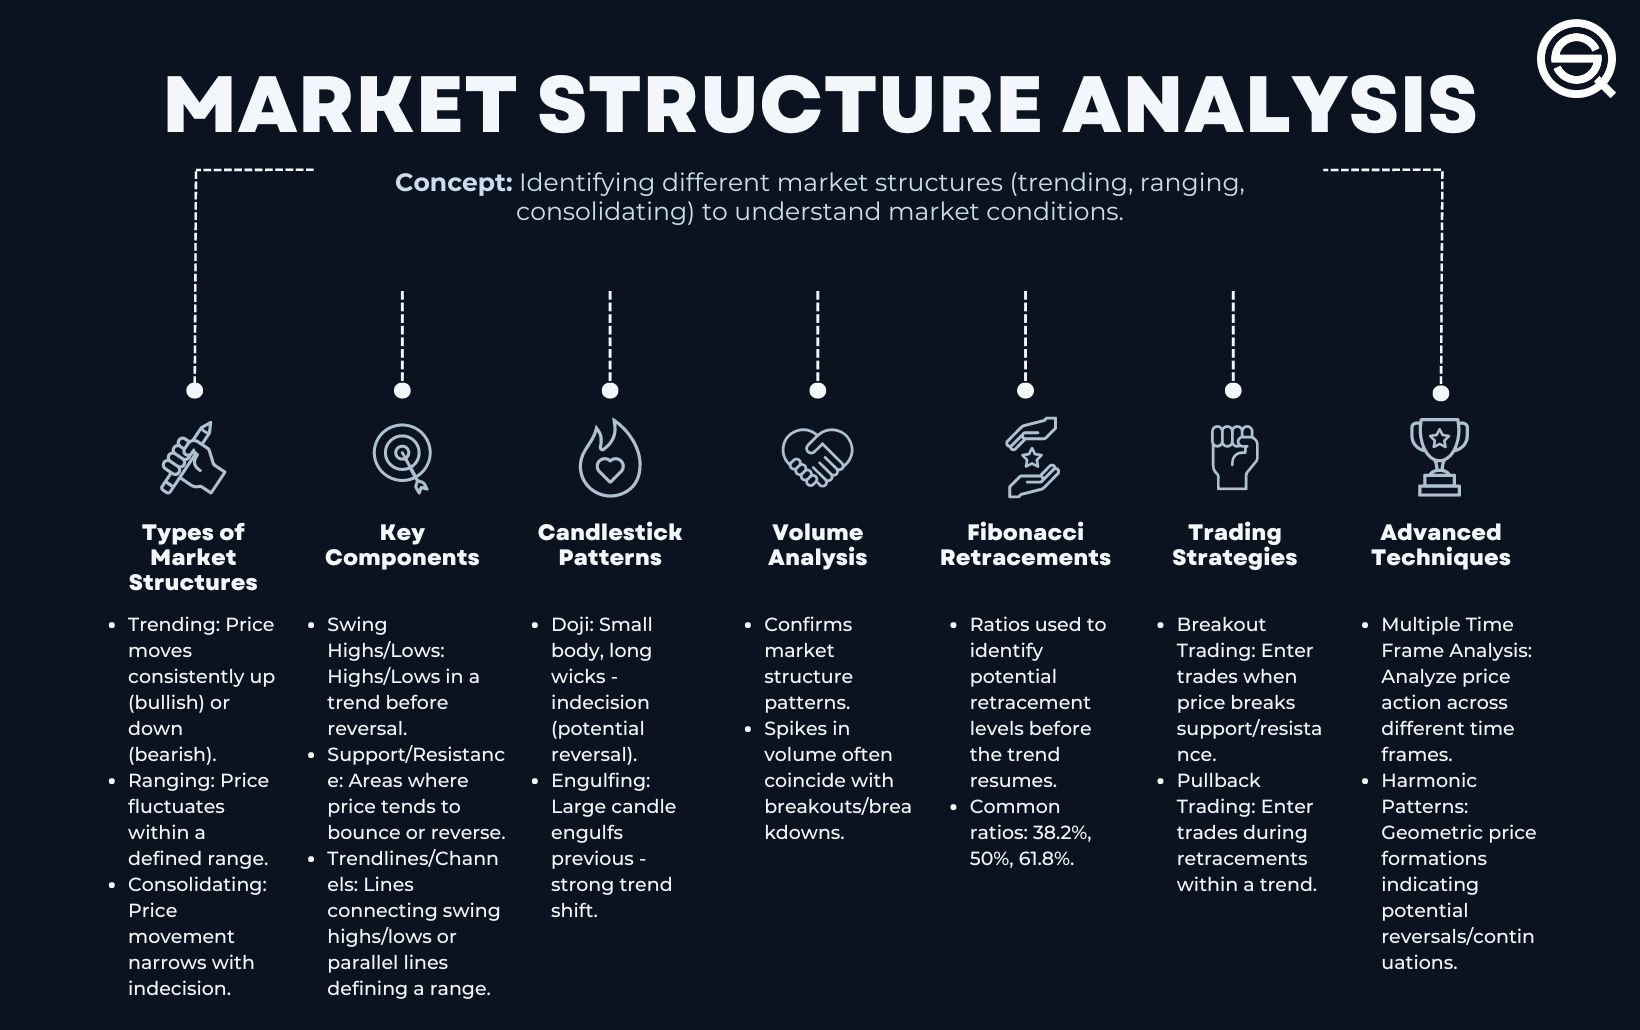
Understanding market structure means recognizing higher highs and higher lows in uptrends, or lower highs and lower lows in downtrends. When this structure breaks, it often signals a major trend change before any indicator catches it.
Volume Profile Trading
While forex doesn’t have centralized volume data, you can use tick volume or futures volume as a proxy. High volume nodes often act as strong support or resistance levels, providing excellent trading opportunities.
Integrating Technical Analysis with Other Trading Approaches
Technical analysis becomes even more powerful when combined with other methodologies:
Technical + Fundamental Analysis
Use technical analysis for timing and fundamental analysis for direction. For example, if fundamental analysis suggests USD strength, use technical analysis to find optimal entry points for USD longs.
Technical Analysis + Sentiment Indicators
Combine your charts with sentiment indicators like the COT (Commitment of Traders) report or retail positioning data. When technical and sentiment extremes align, you often get the highest probability trades.
Your Technical Analysis Action Plan
Ready to implement what you’ve learned? Here’s your step-by-step action plan:
- Week 1-2: Master support and resistance identification. Practice on historical charts before trading live.
- Week 3-4: Add one momentum indicator (RSI or MACD) to your analysis. Paper trade using these tools together.
- Week 5-6: Learn one chart pattern thoroughly. Focus on quality setups rather than quantity.
- Week 7-8: Develop your trading plan combining all elements. Include entry rules, exit rules, and risk management.
- Ongoing: Keep a trading journal to track what works and what doesn’t. Continuous improvement is key.
Tools and Resources for Technical Analysis
To support your technical analysis journey, consider these resources:
- Charting Platforms: TradingView, MetaTrader 4/5, or NinjaTrader offer comprehensive technical analysis tools
- Educational Resources: BabyPips School of Pipsology provides free, structured learning
- Practice Accounts: Use demo accounts to practice without risking real money
- Trading Tools: Explore professional indicators and Expert Advisors to enhance your analysis
Conclusion: Your Path to Technical Analysis Mastery
Technical analysis in forex trading isn’t just about memorizing patterns or indicators – it’s about developing a deep understanding of market behavior and having the discipline to follow your analysis. Whether you’re a complete beginner taking your first steps or an experienced trader looking to refine your approach, the principles and techniques we’ve covered provide a solid foundation for success.
Remember, becoming proficient in technical analysis is a journey, not a destination. Start with the basics, practice consistently, and gradually add complexity as your confidence grows. The forex market rewards those who combine knowledge with patience and discipline.
What aspect of technical analysis will you focus on improving first? Your journey to becoming a skilled technical trader starts with that single decision. Take action today, and let the charts guide your path to trading success.
Final Thought: “In trading, the person who is most flexible and adapts quickest to changing market conditions will ultimately succeed. Technical analysis gives you the tools – how you use them determines your results.”